Contact us
How to create input from Vina results
Below are 6 images to create the input required for processing results from the Vina software.
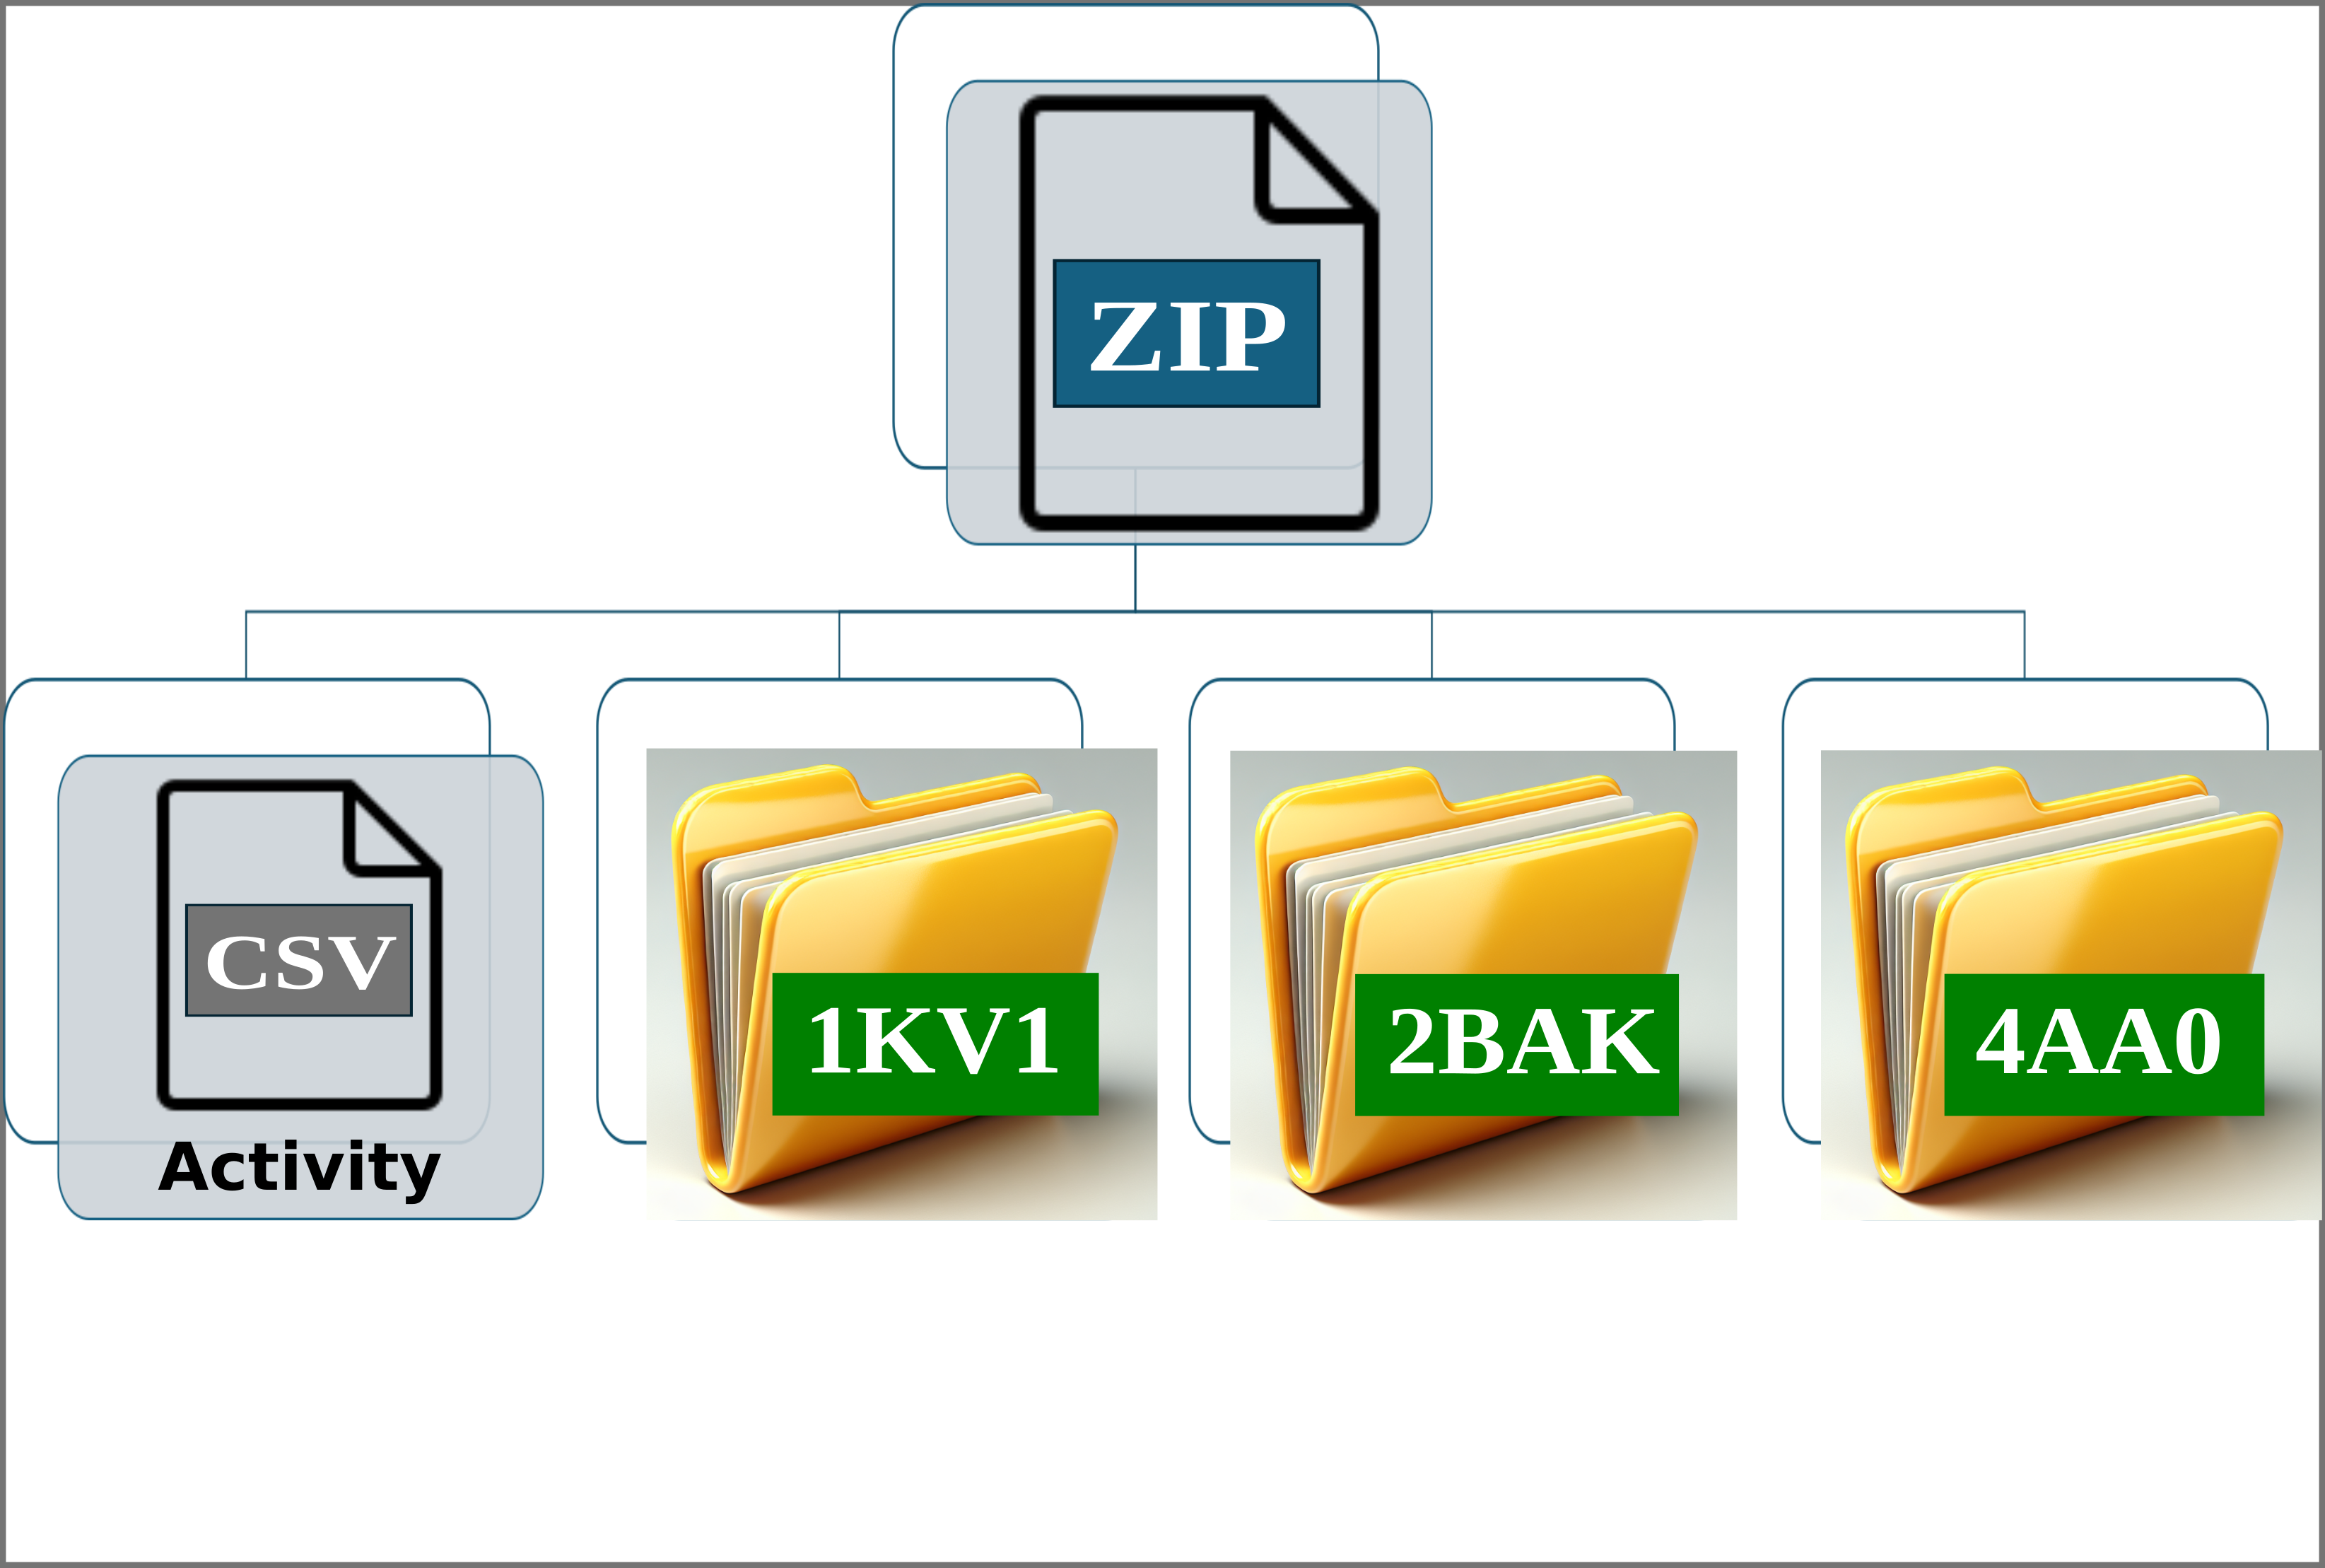
Img. 1: General input scheme.
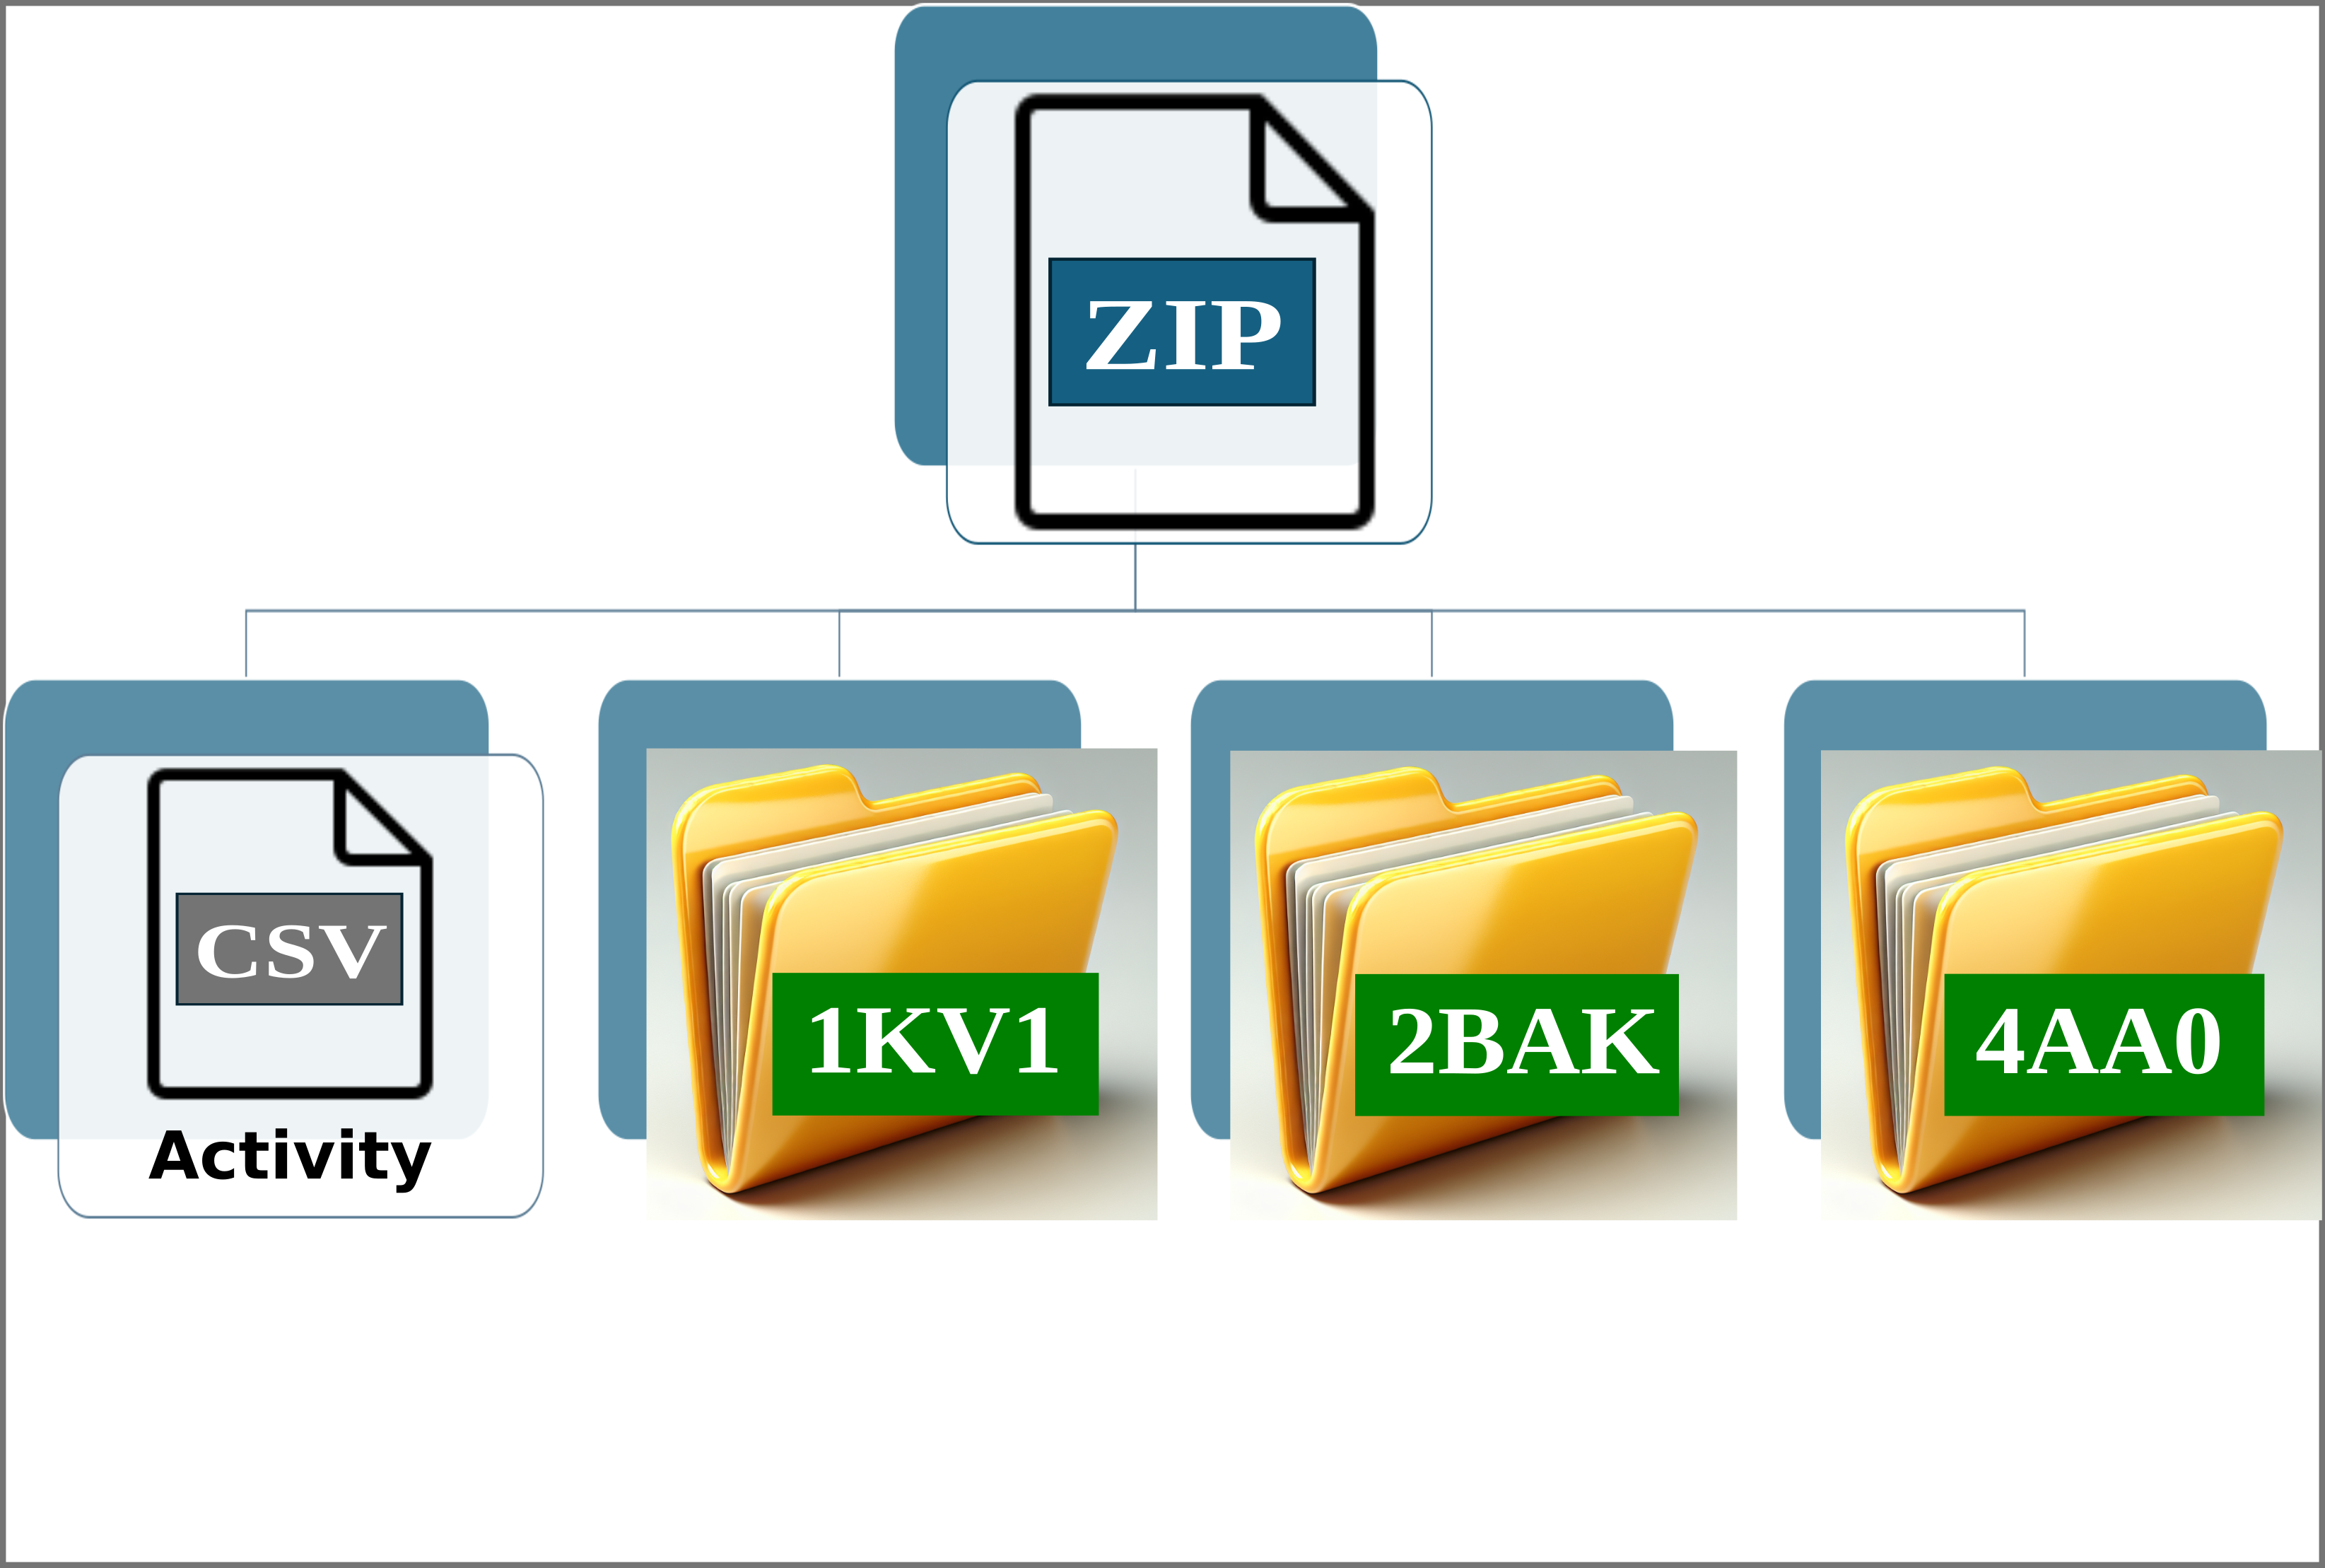
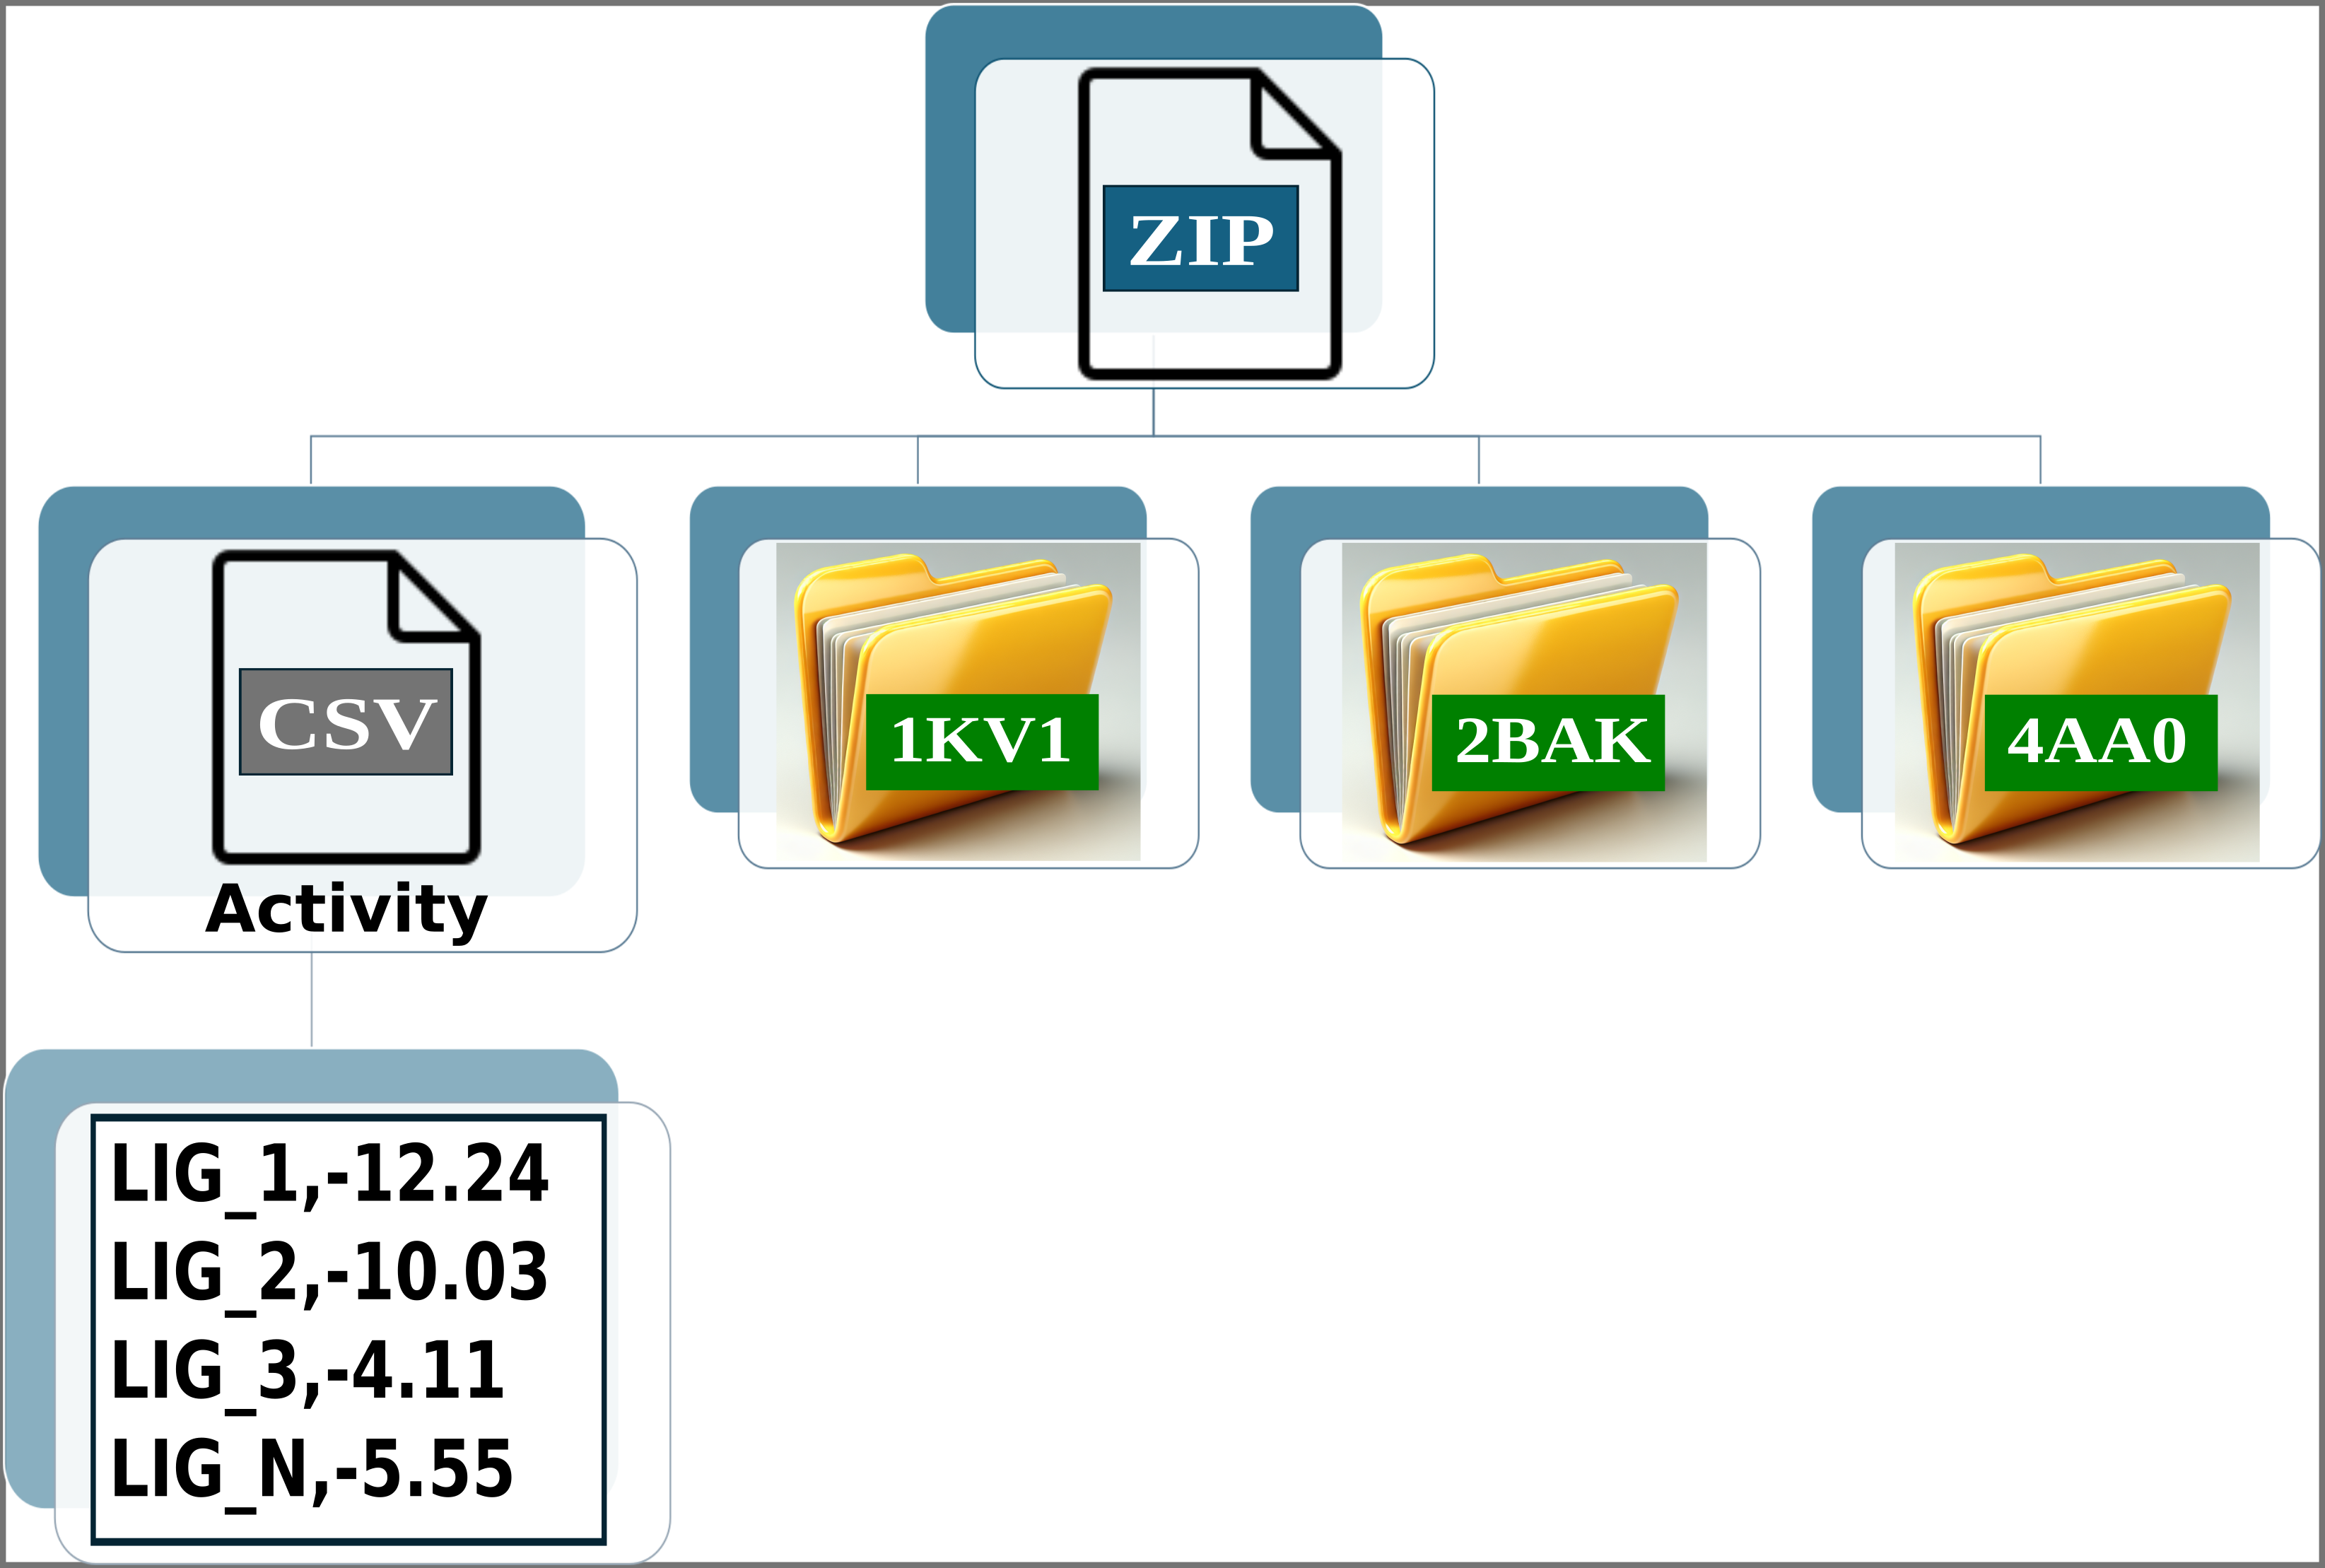
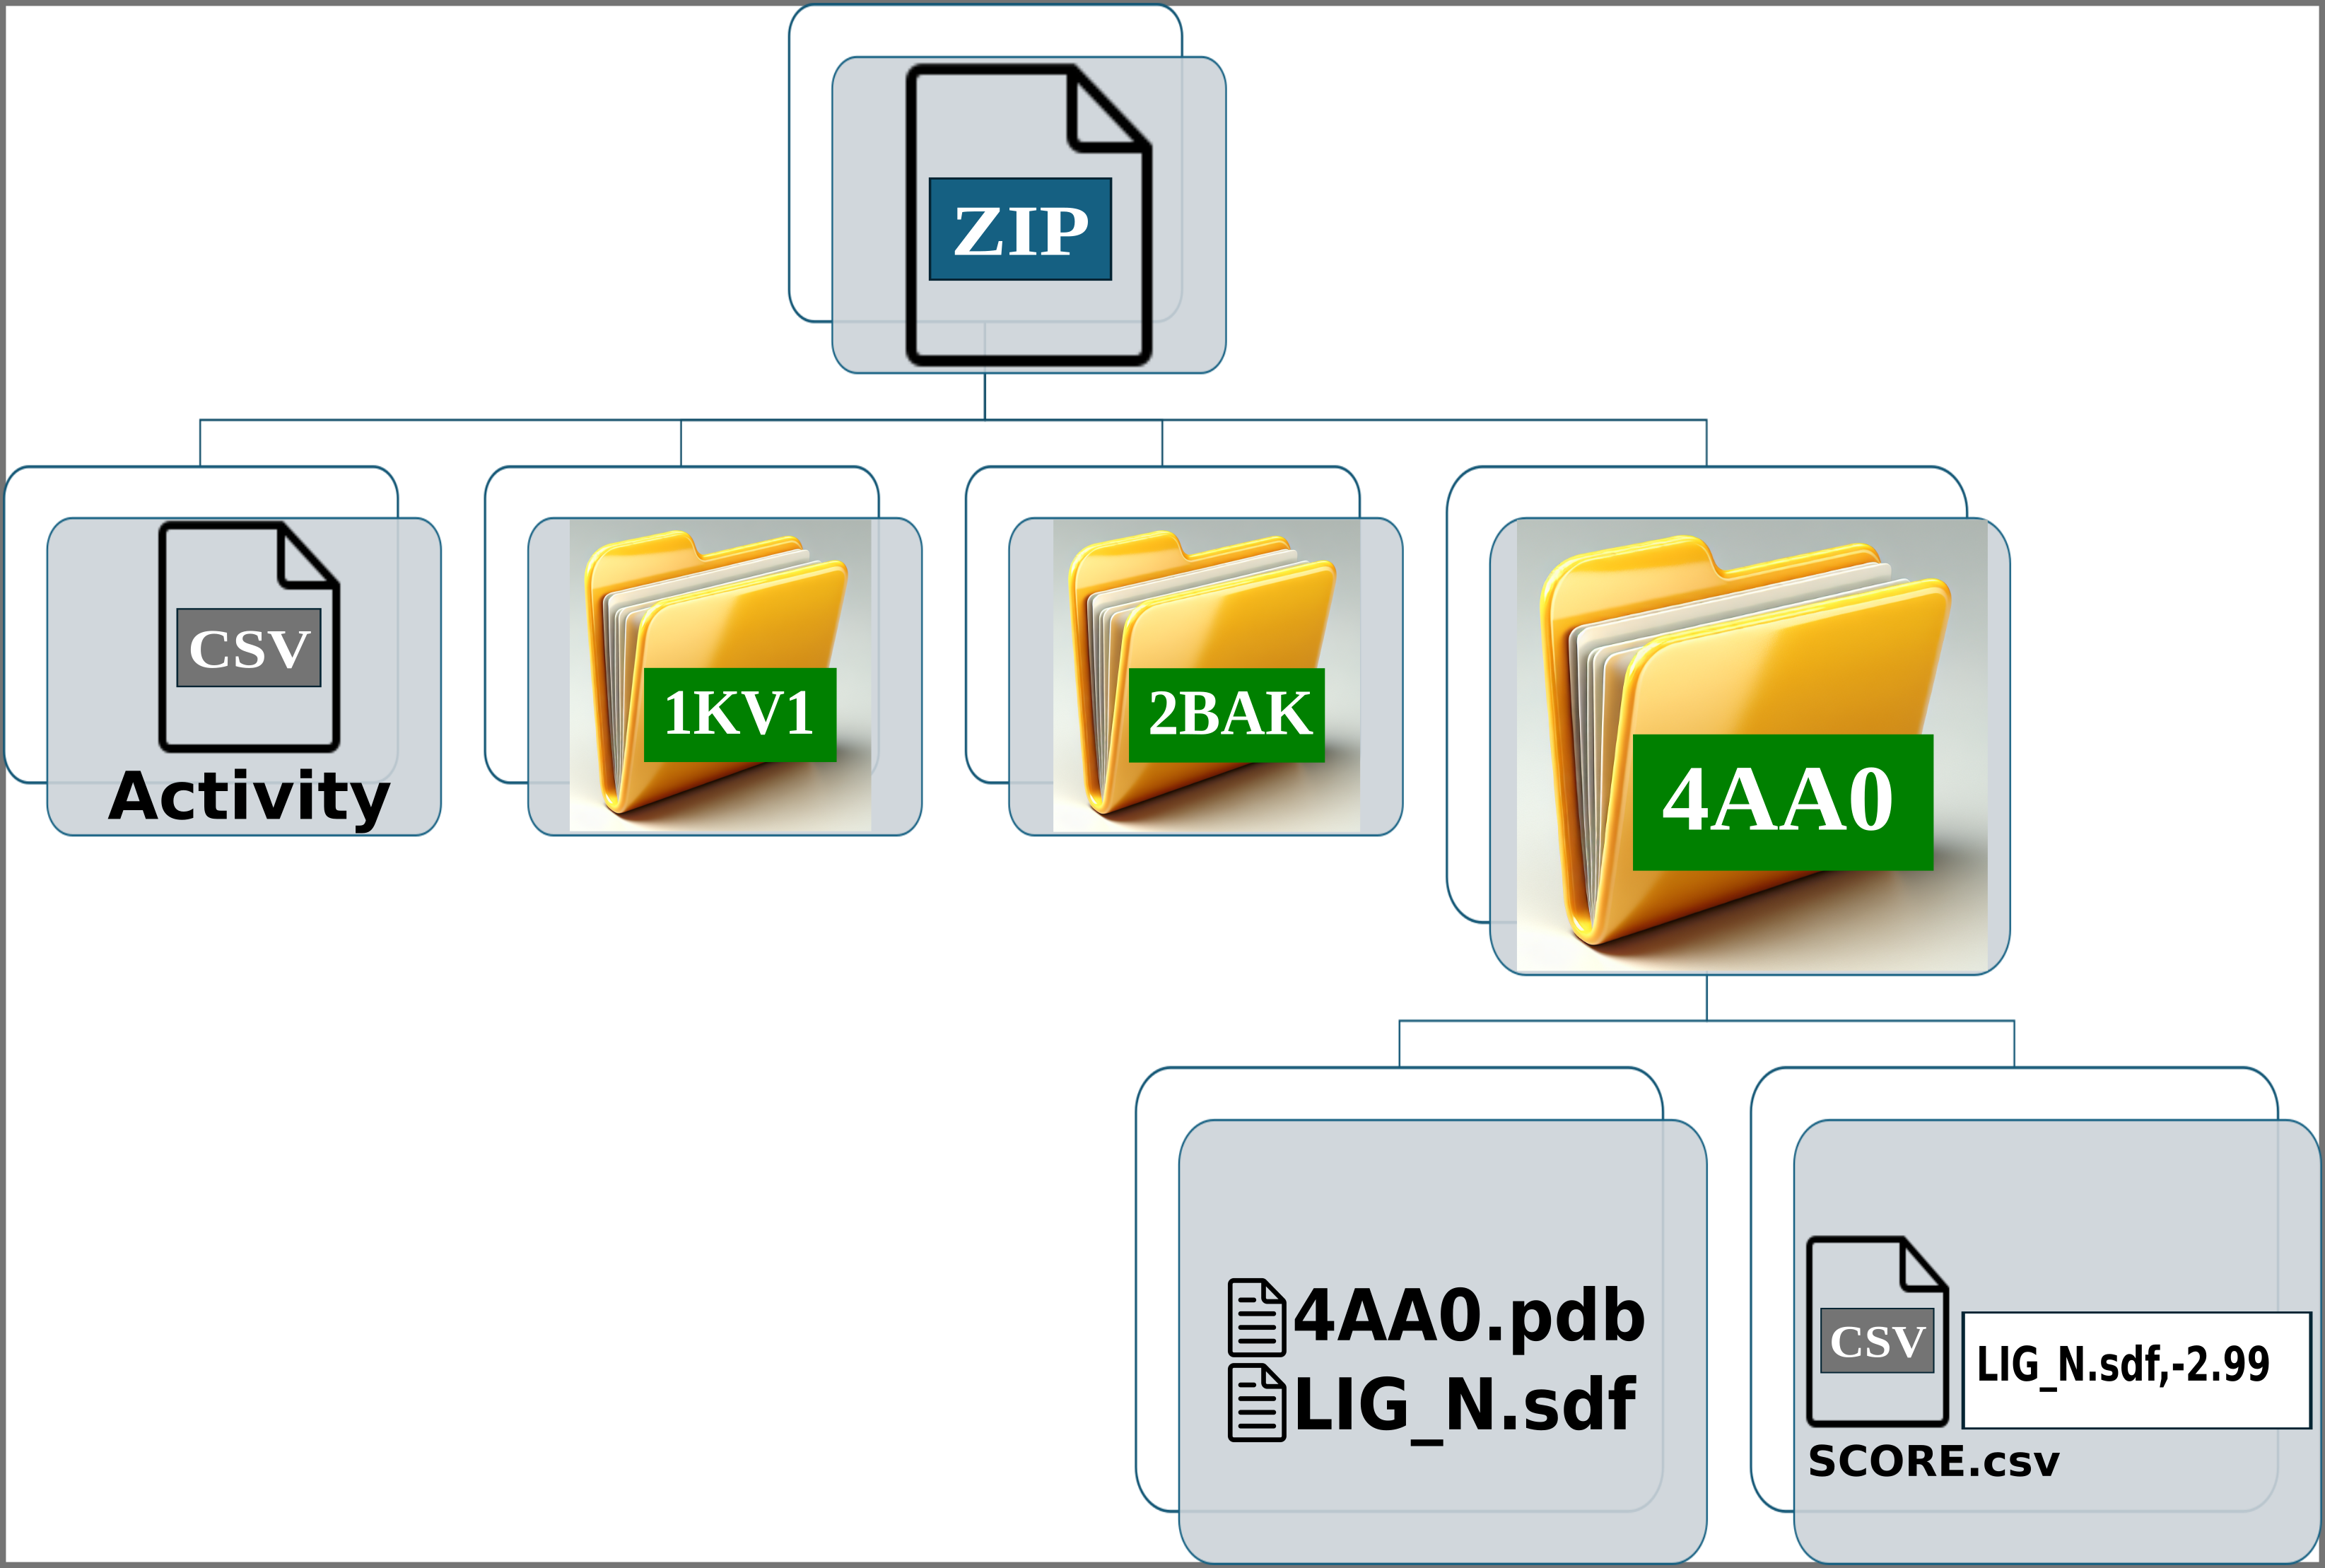
Img. 2: The platform accepts a ZIP file containing a CSV file and several folders representing protein conformations. In this case, the folders correspond to the P38alpha protein.
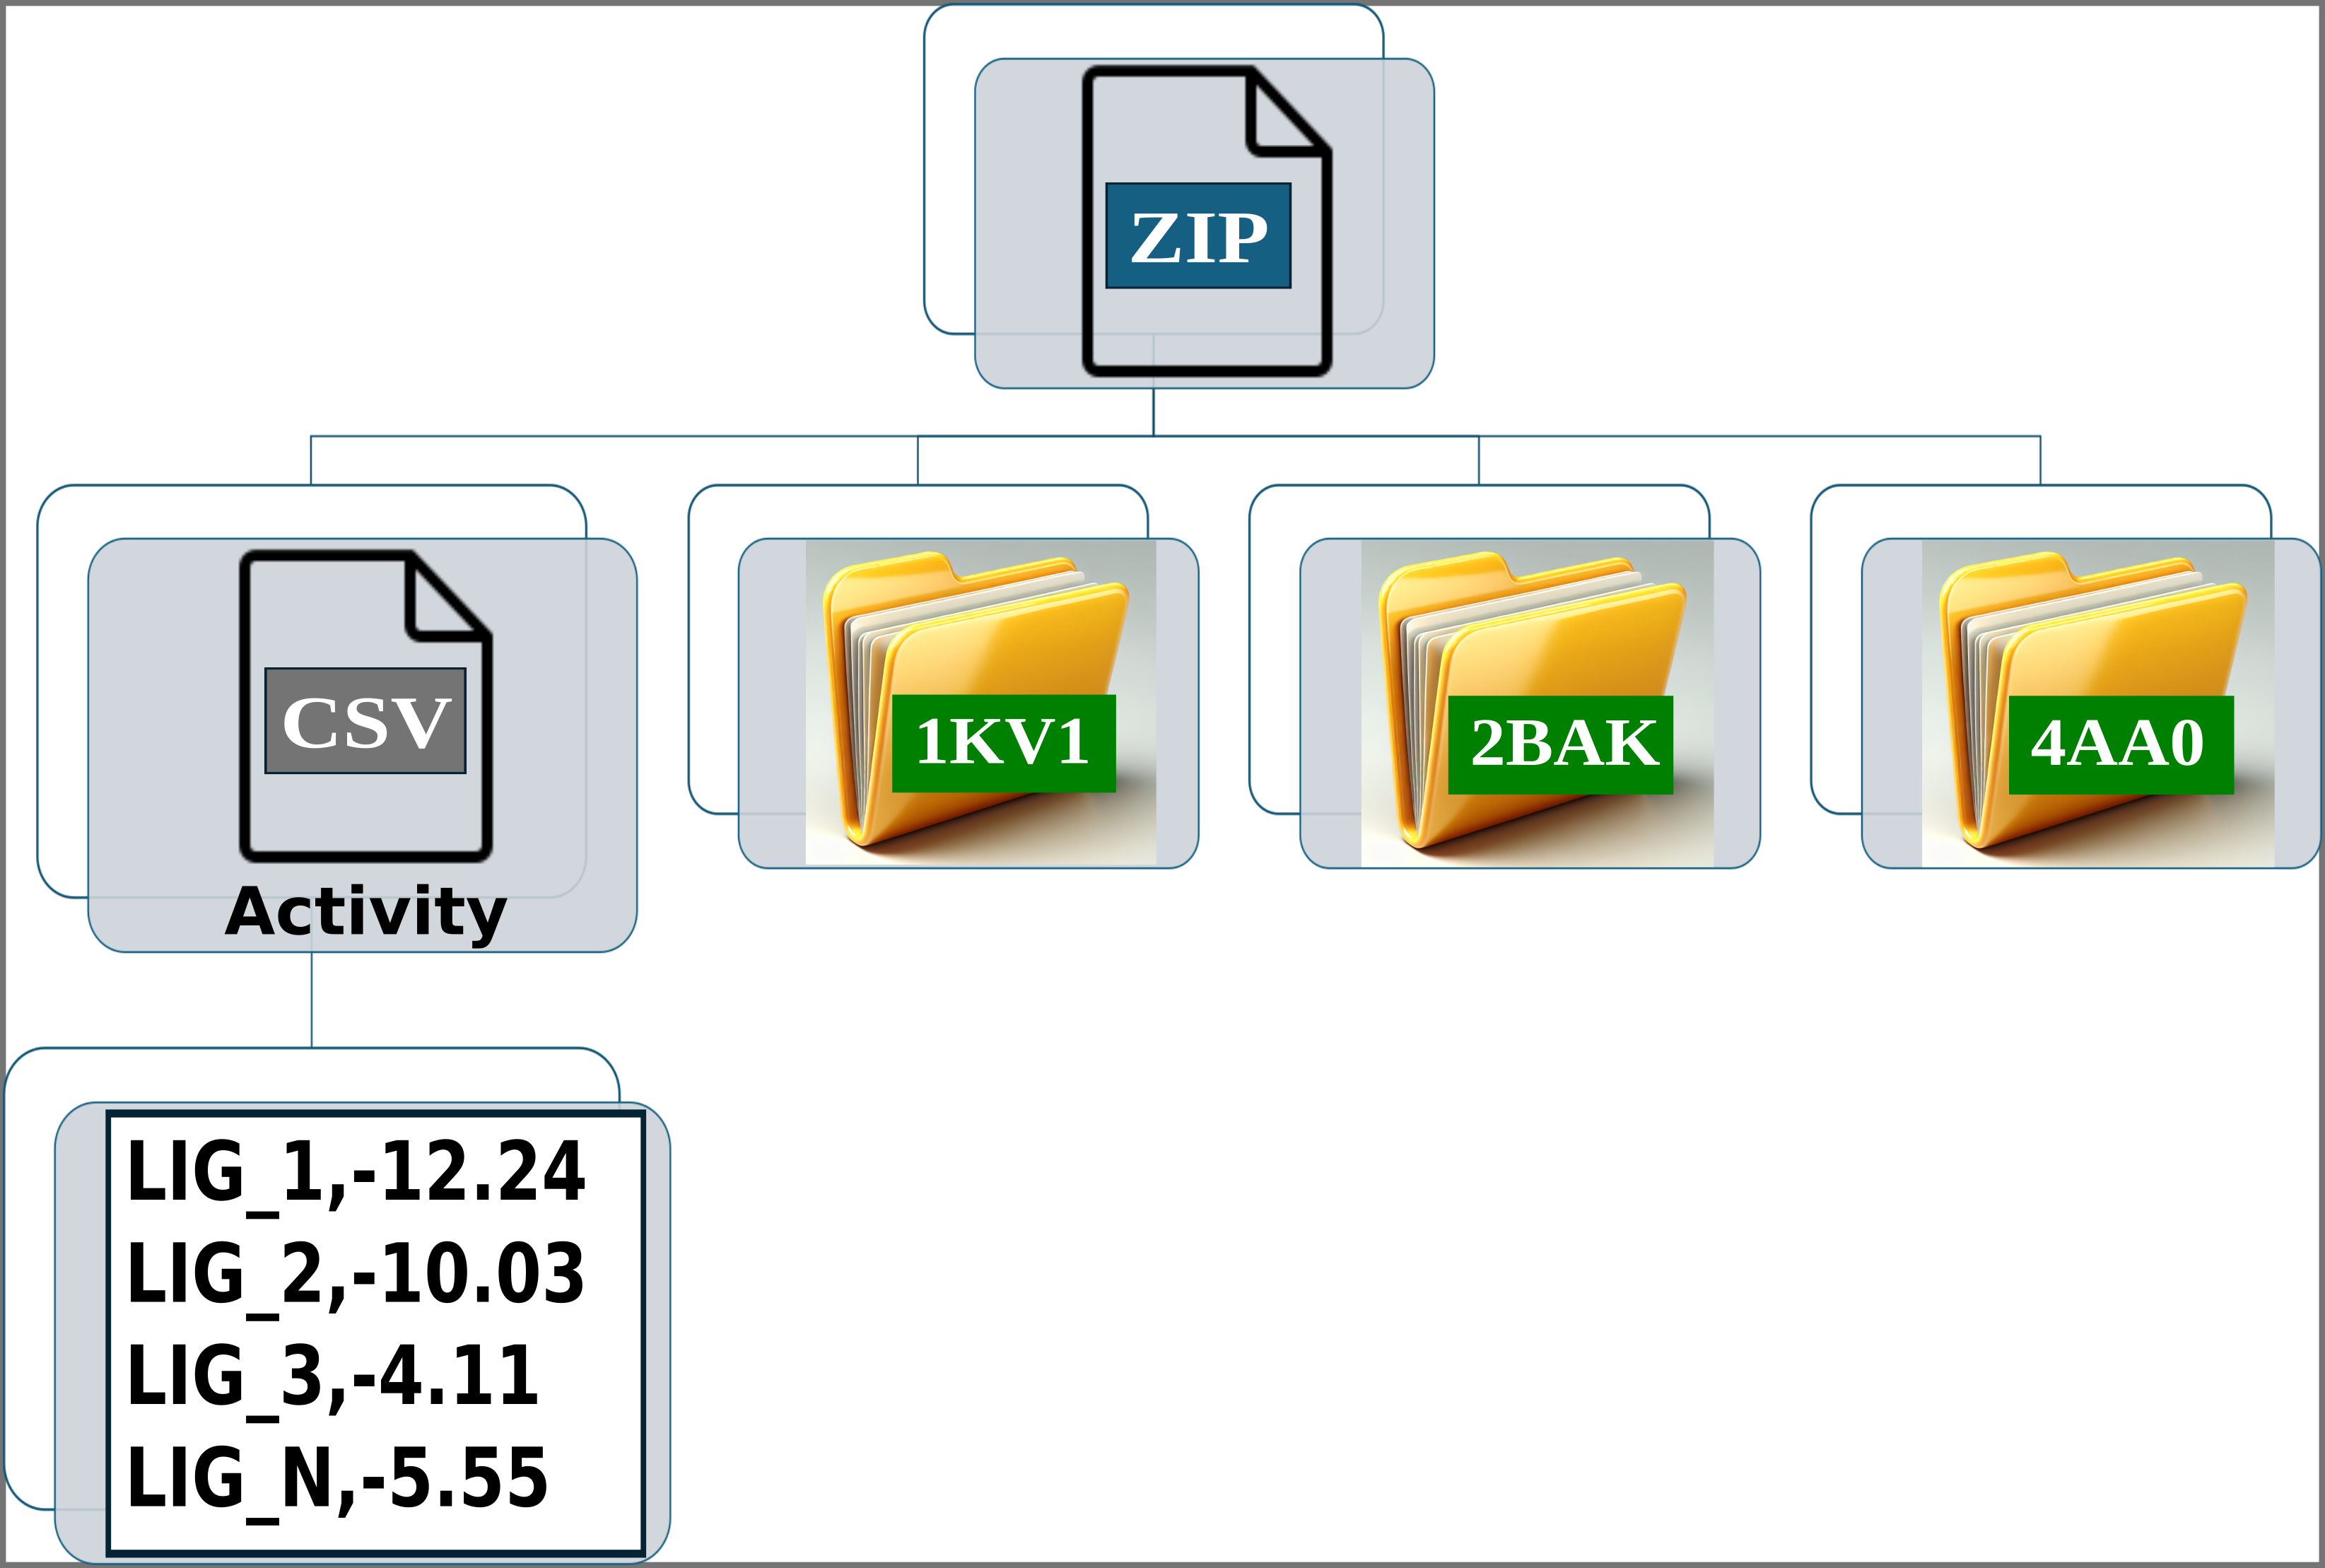
Img. 3: The CSV file must contain two columns separated by commas. The first column should list the names of the ligands, and the second should include their normalized experimental activity values.
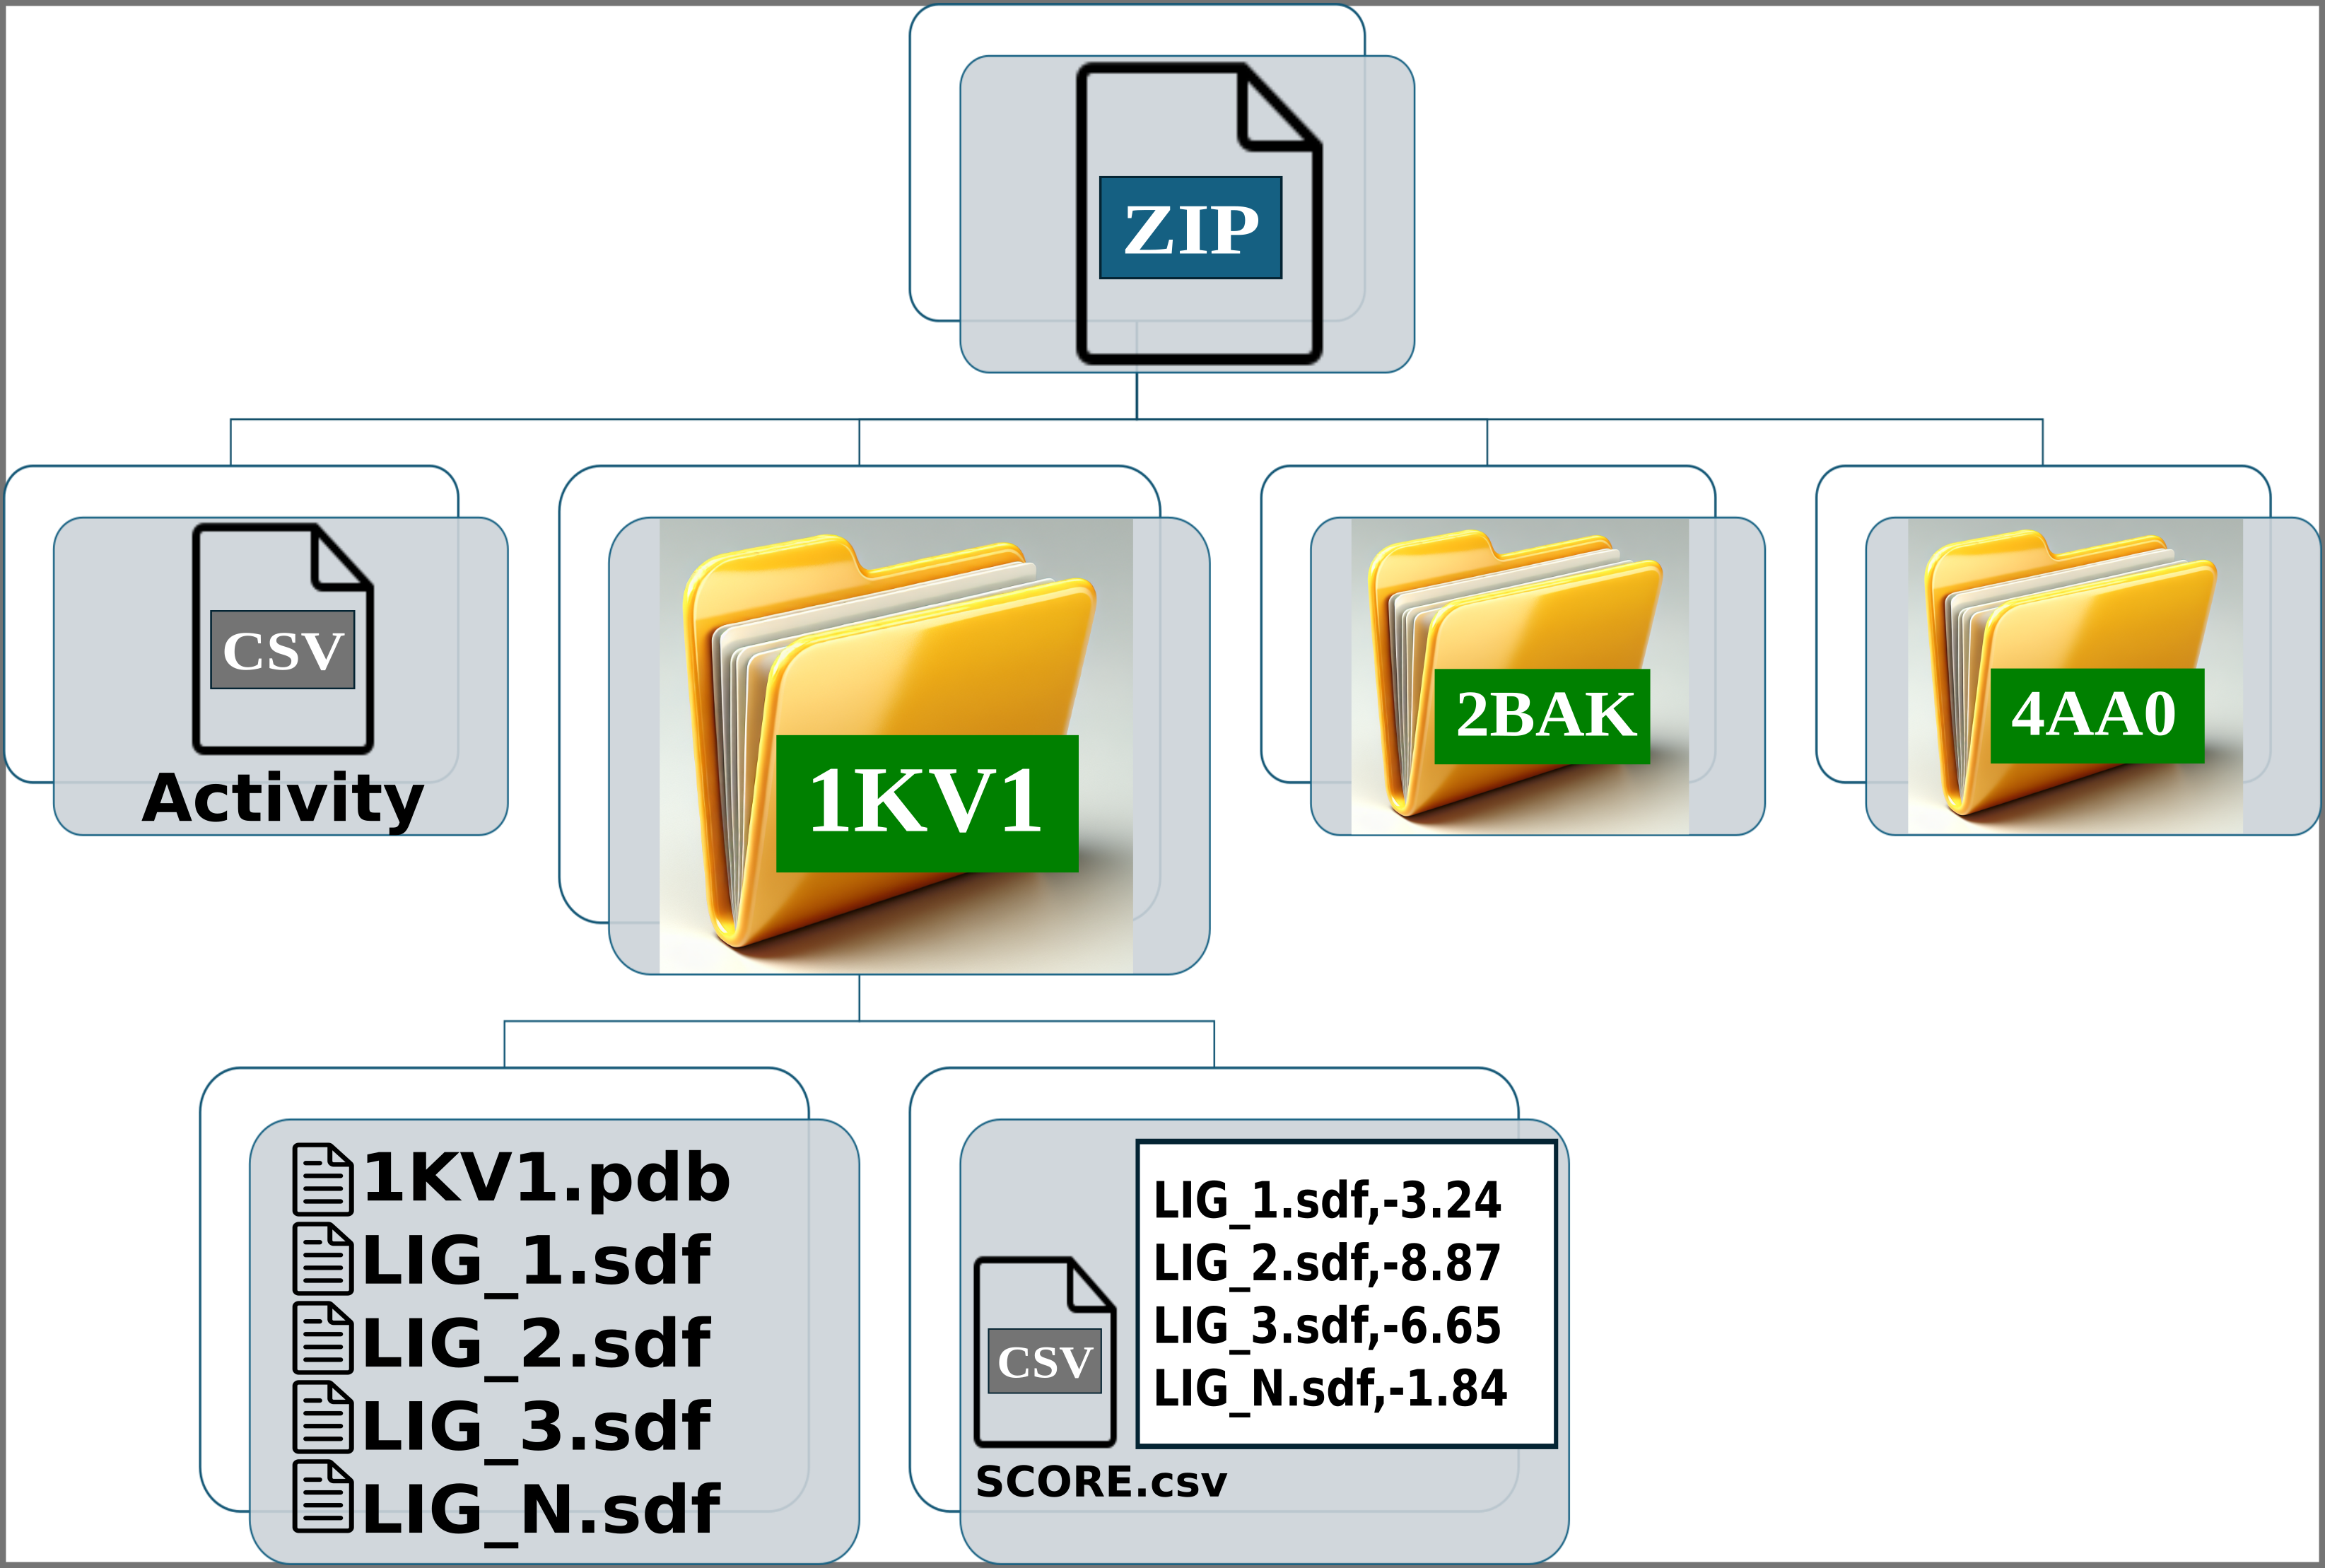
Img. 4-6: Each folder must include the protein conformations in PDB format and the ligands in PDBQT format.
Imagen 1/6
Click the arrow button to switch to the next image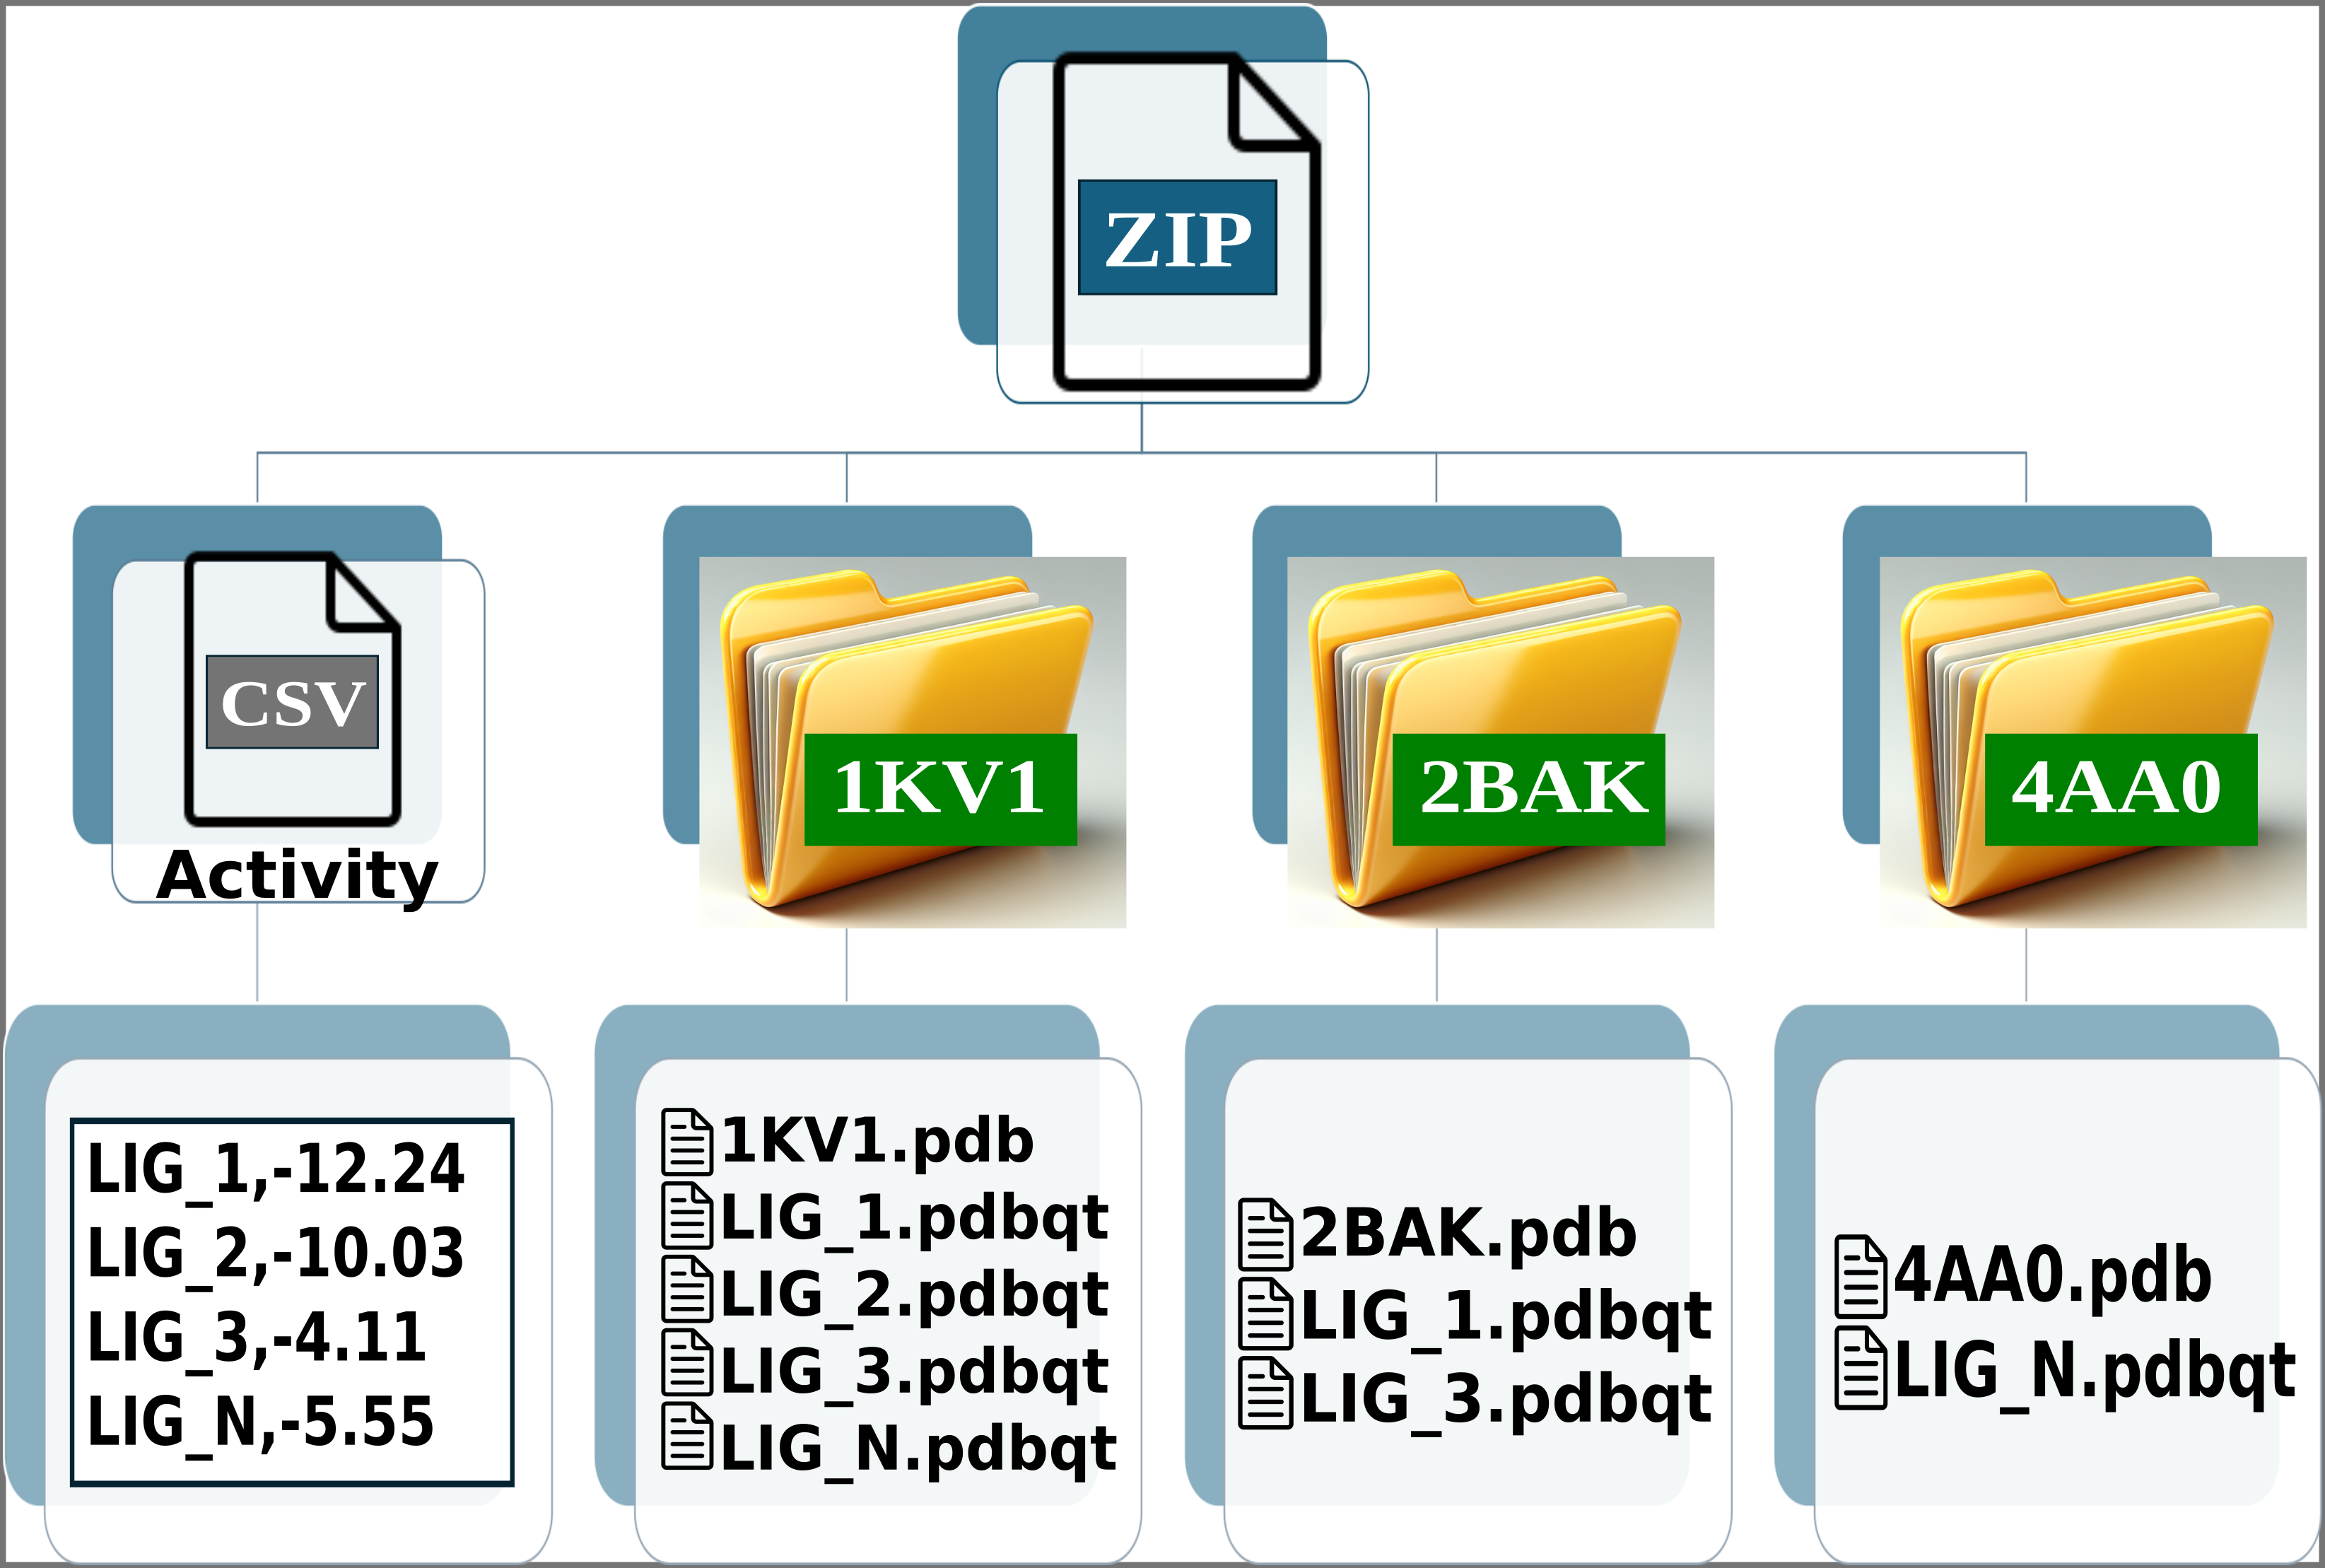
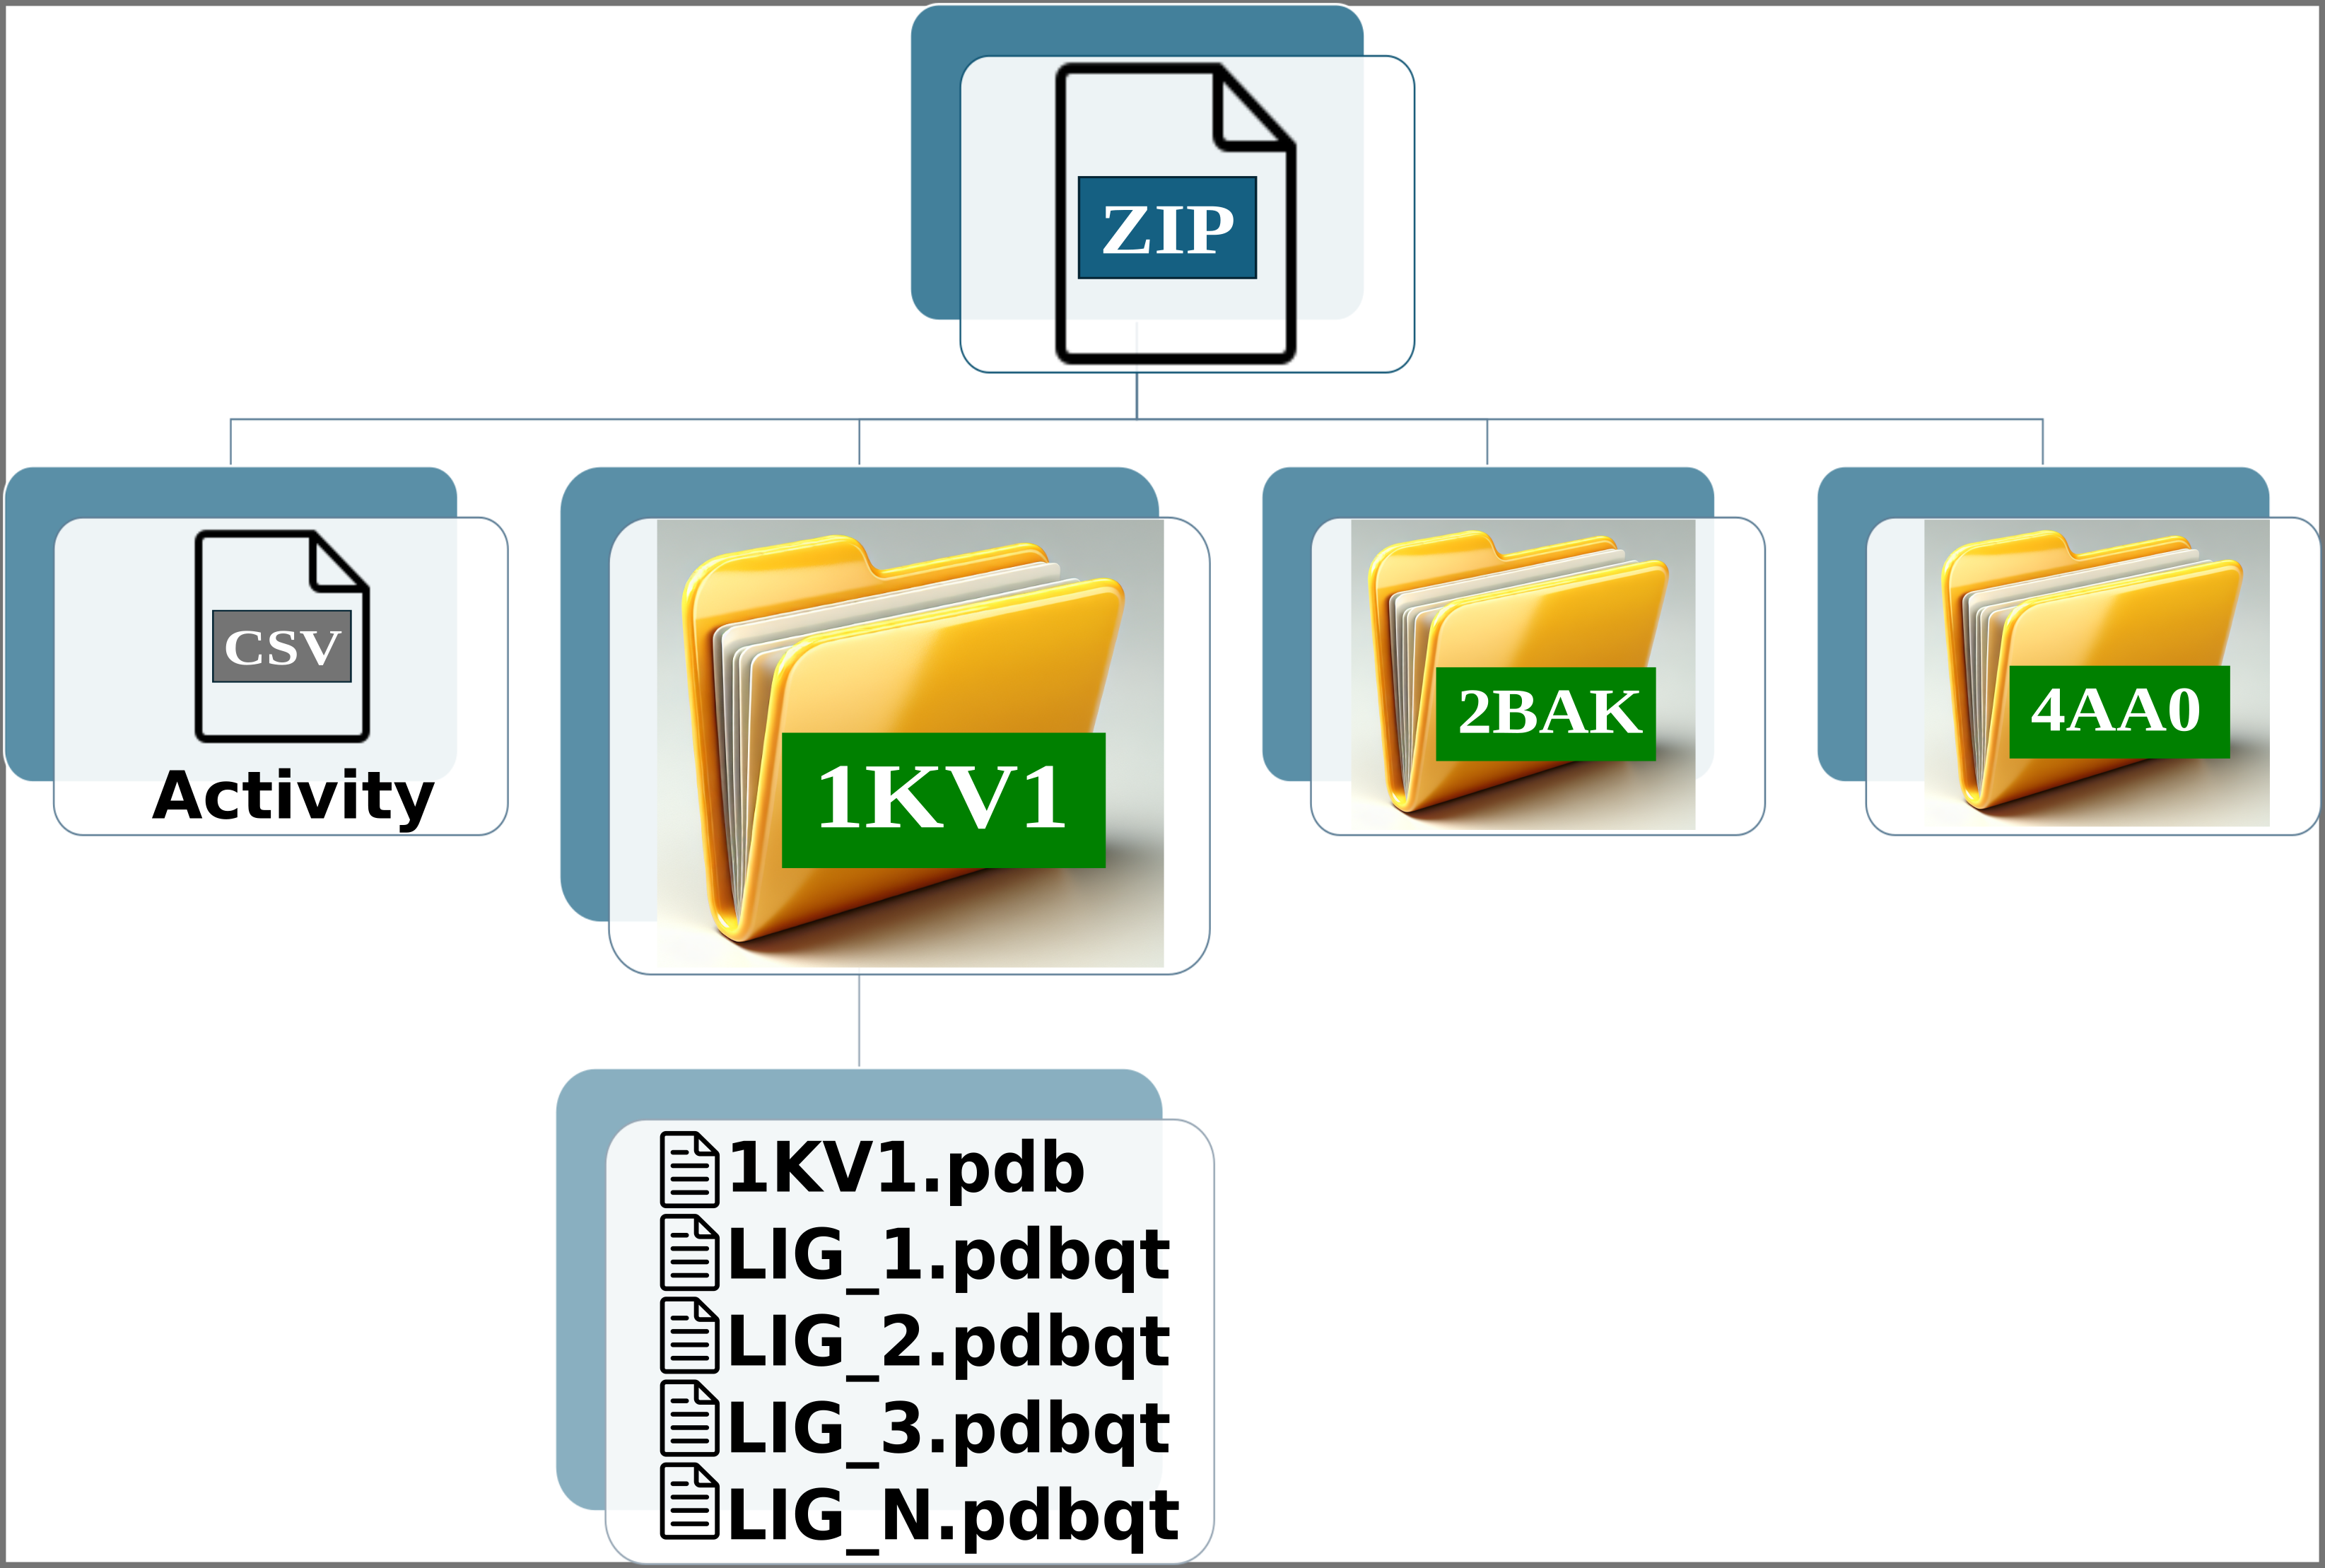
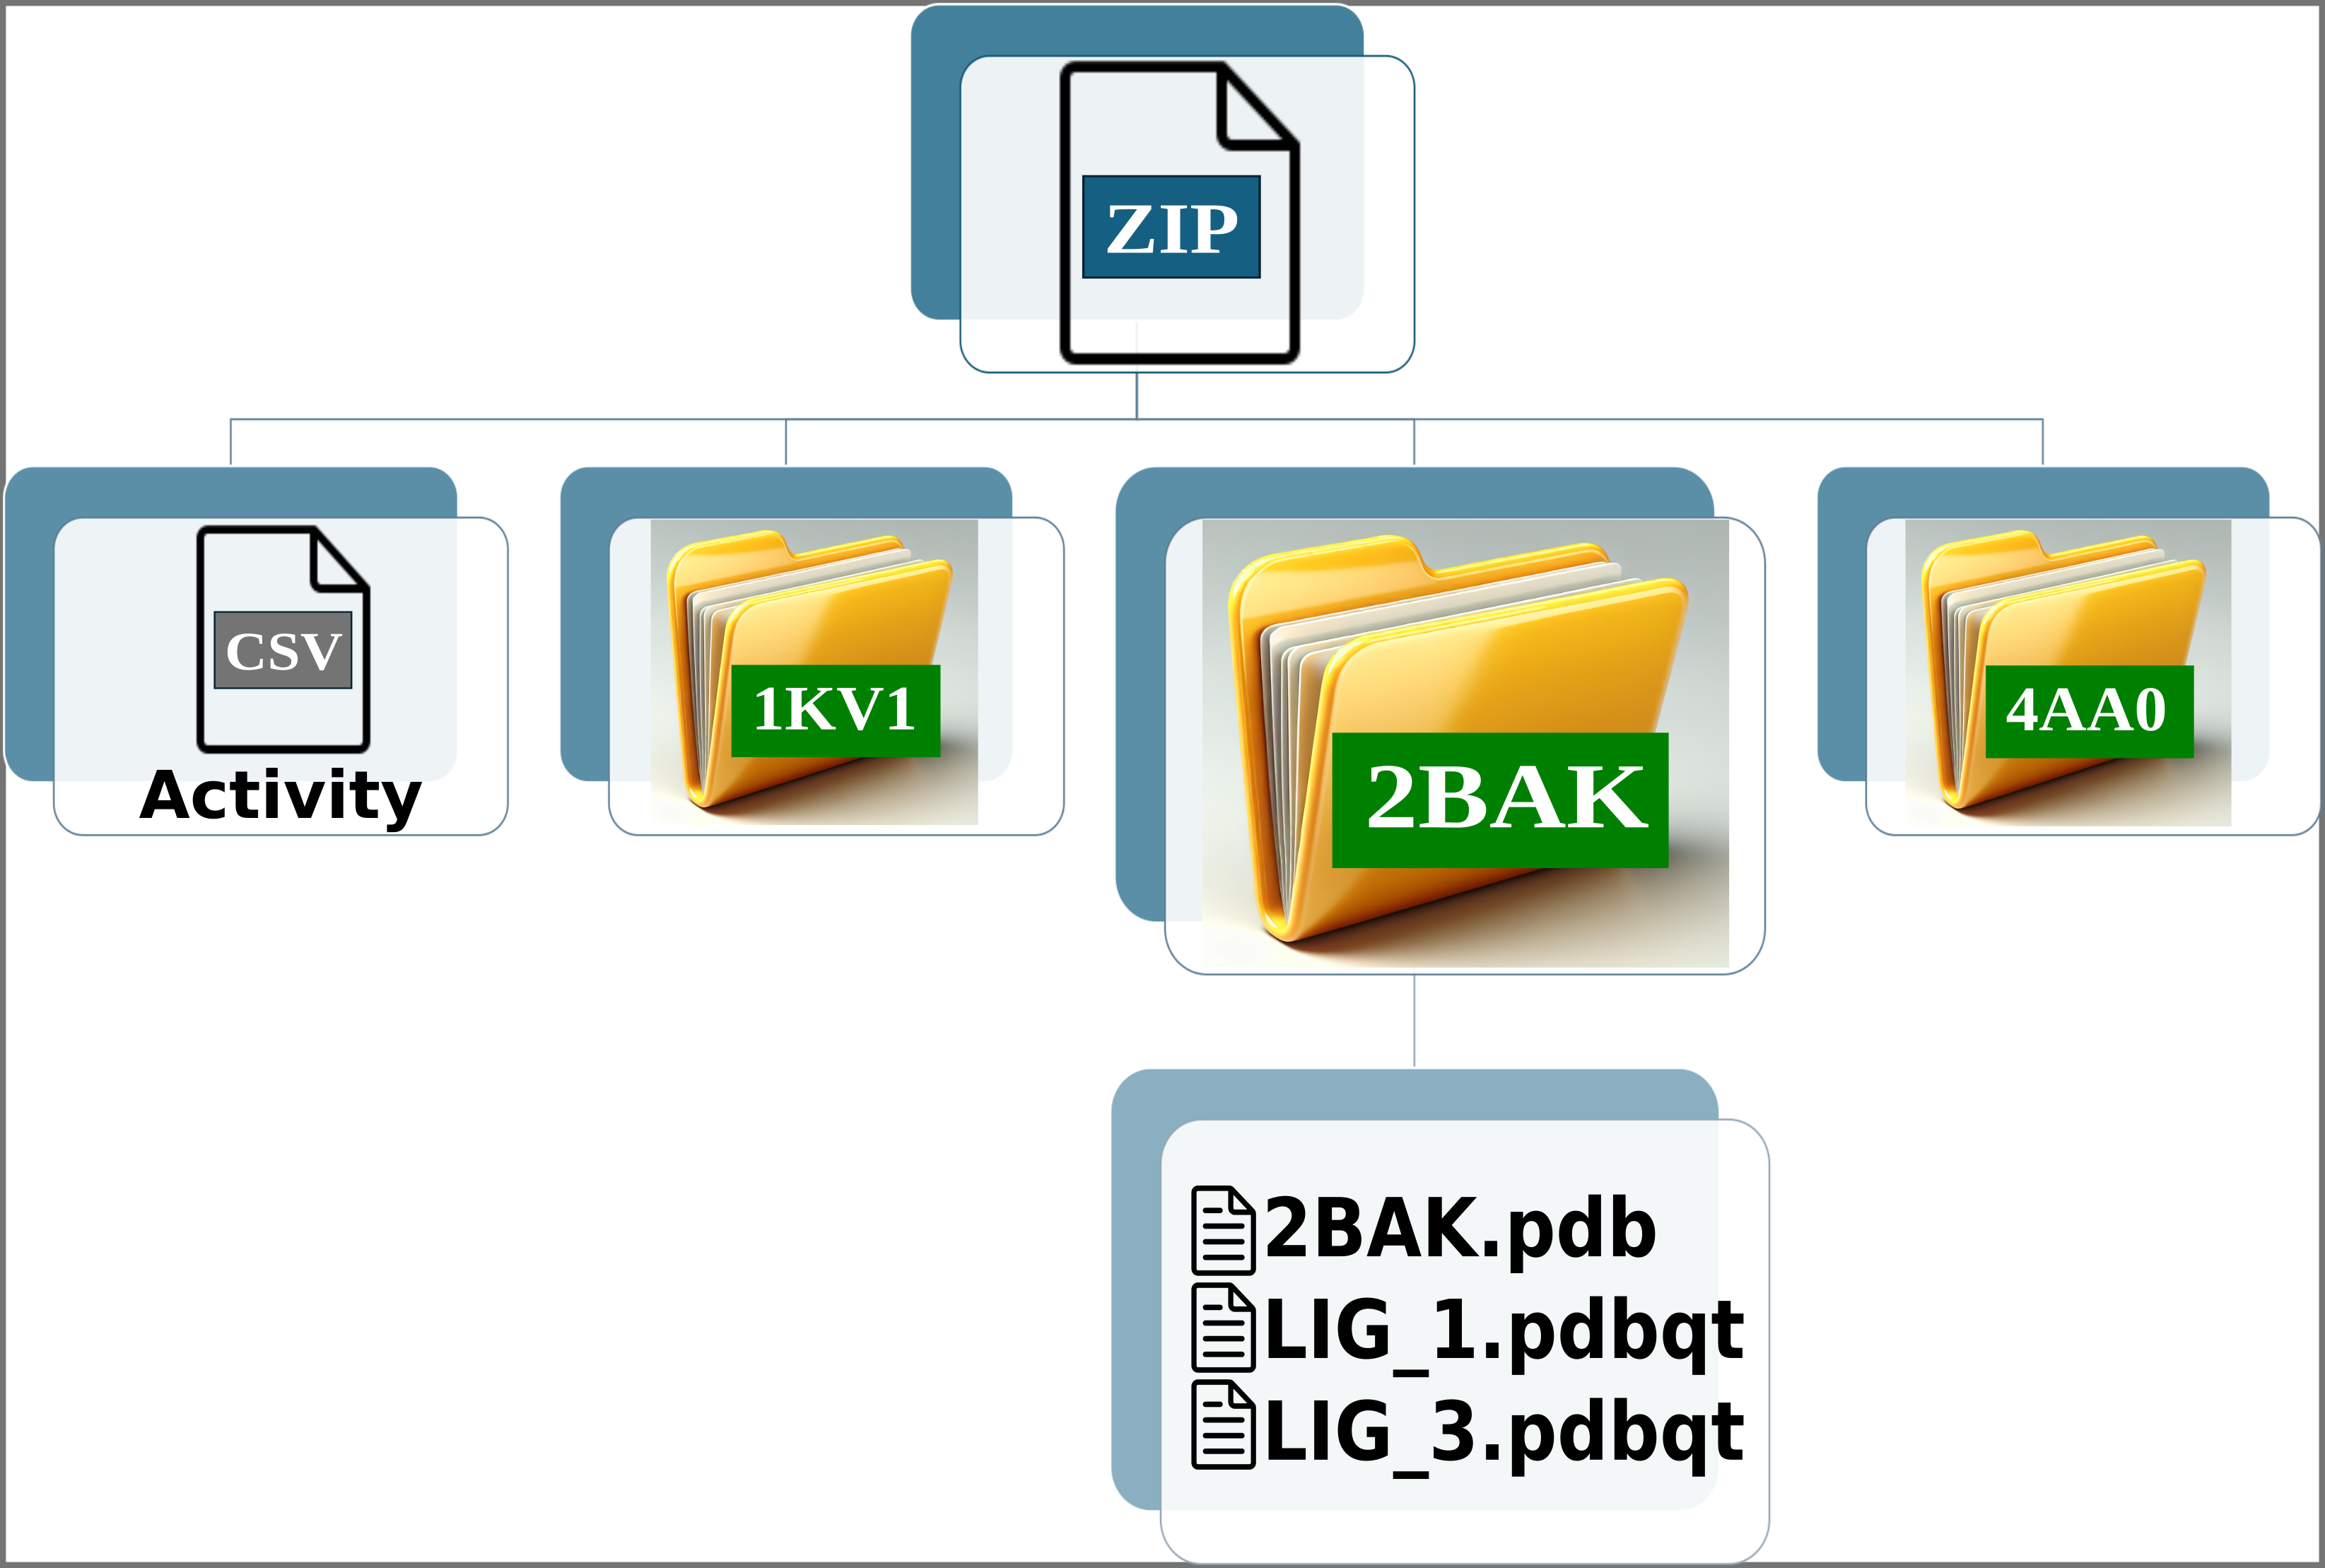
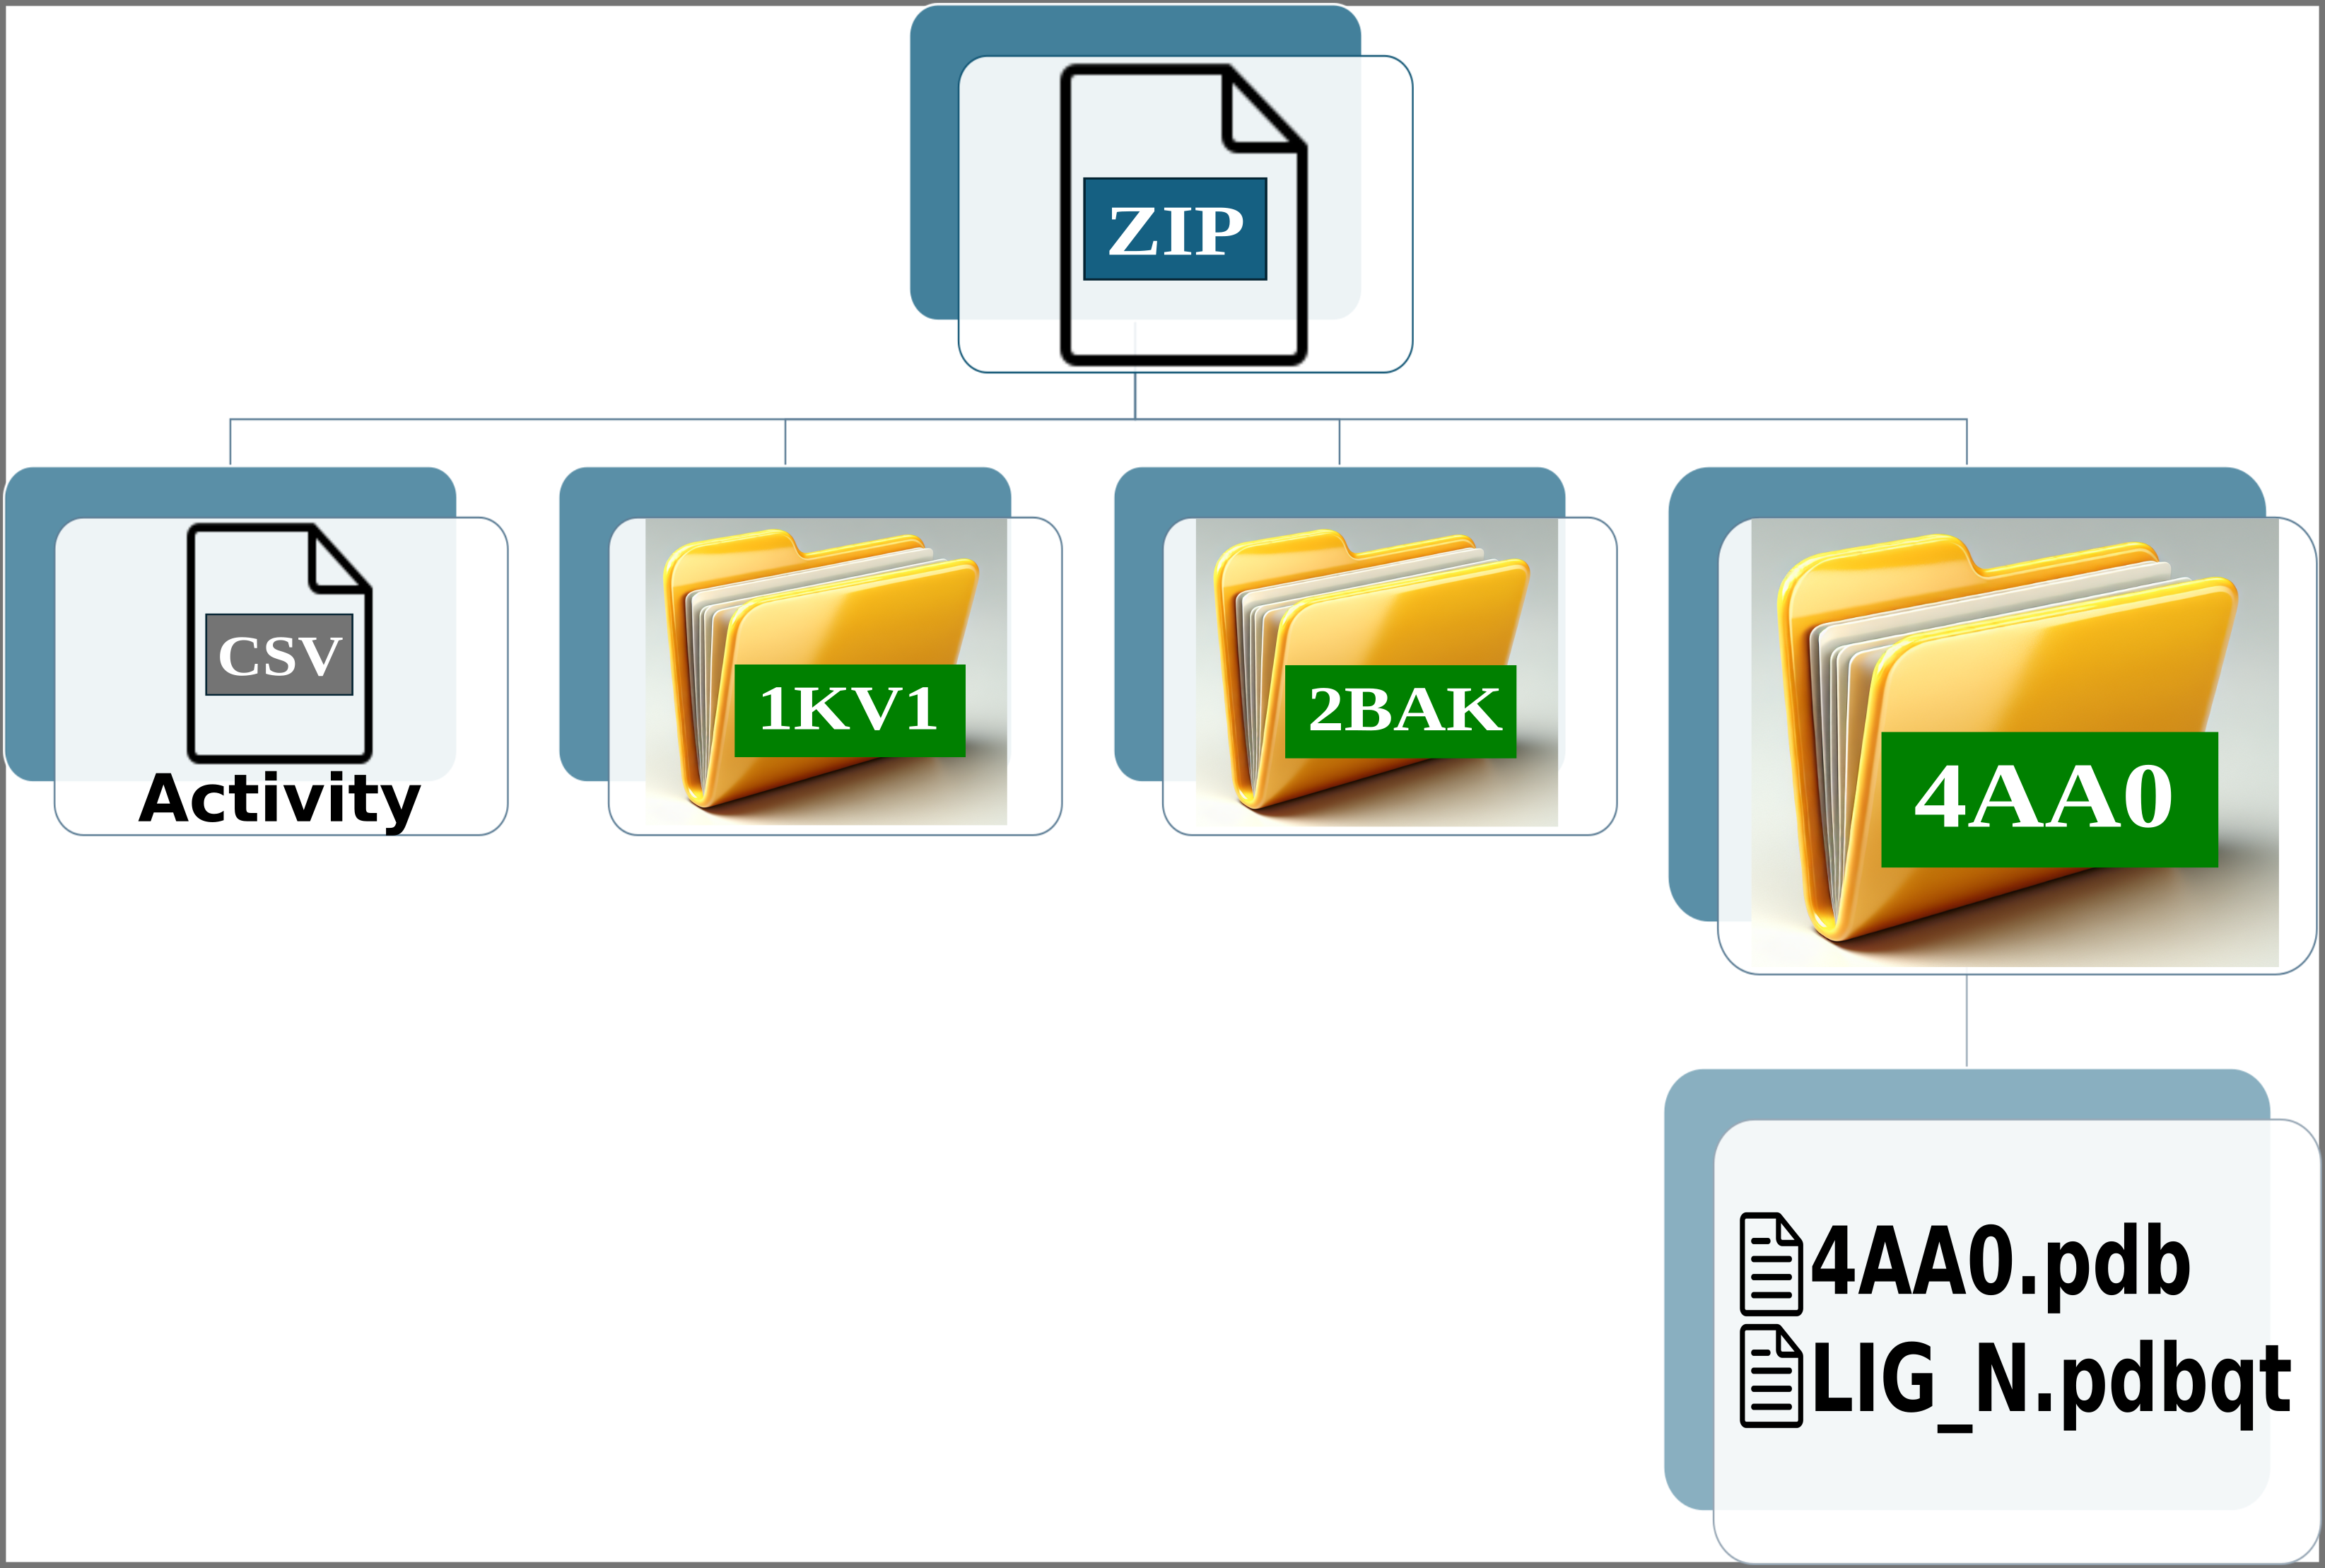
The names of the ligands in the CSV file must match the names of the PDBQT files. For example, if a ligand is named LIG_1 in the CSV, its corresponding file in the folders should be LIG_1.pdbqt. Additionally, all ligands in the CSV file must have an associated experimental activity. Finally, each folder must contain one protein in PDB format and one or more PDBQT files corresponding to the ligands.
How to create input from other docking results
Below are 6 images used to create the input required for processing results from other docking software.
Img. 1: General input scheme.
Img. 2: The platform accepts a ZIP file containing a CSV file and several folders representing protein conformations. In this case, the folders correspond to the P38alpha protein.
Img. 3: The CSV file must contain two columns separated by commas. The first column should list the names of the ligands, and the second should include their normalized experimental activity values.
Img. 4-6: Each folder should contain the protein conformation in PDB format, while the ligands should be in SDF or MOL format. Additionally, a CSV file must be included, containing two columns separated by commas: the first column should list the ligand file names, and the second should contain their computationally measured scores.
Imagen 1/6
Click the arrow button to switch to the next image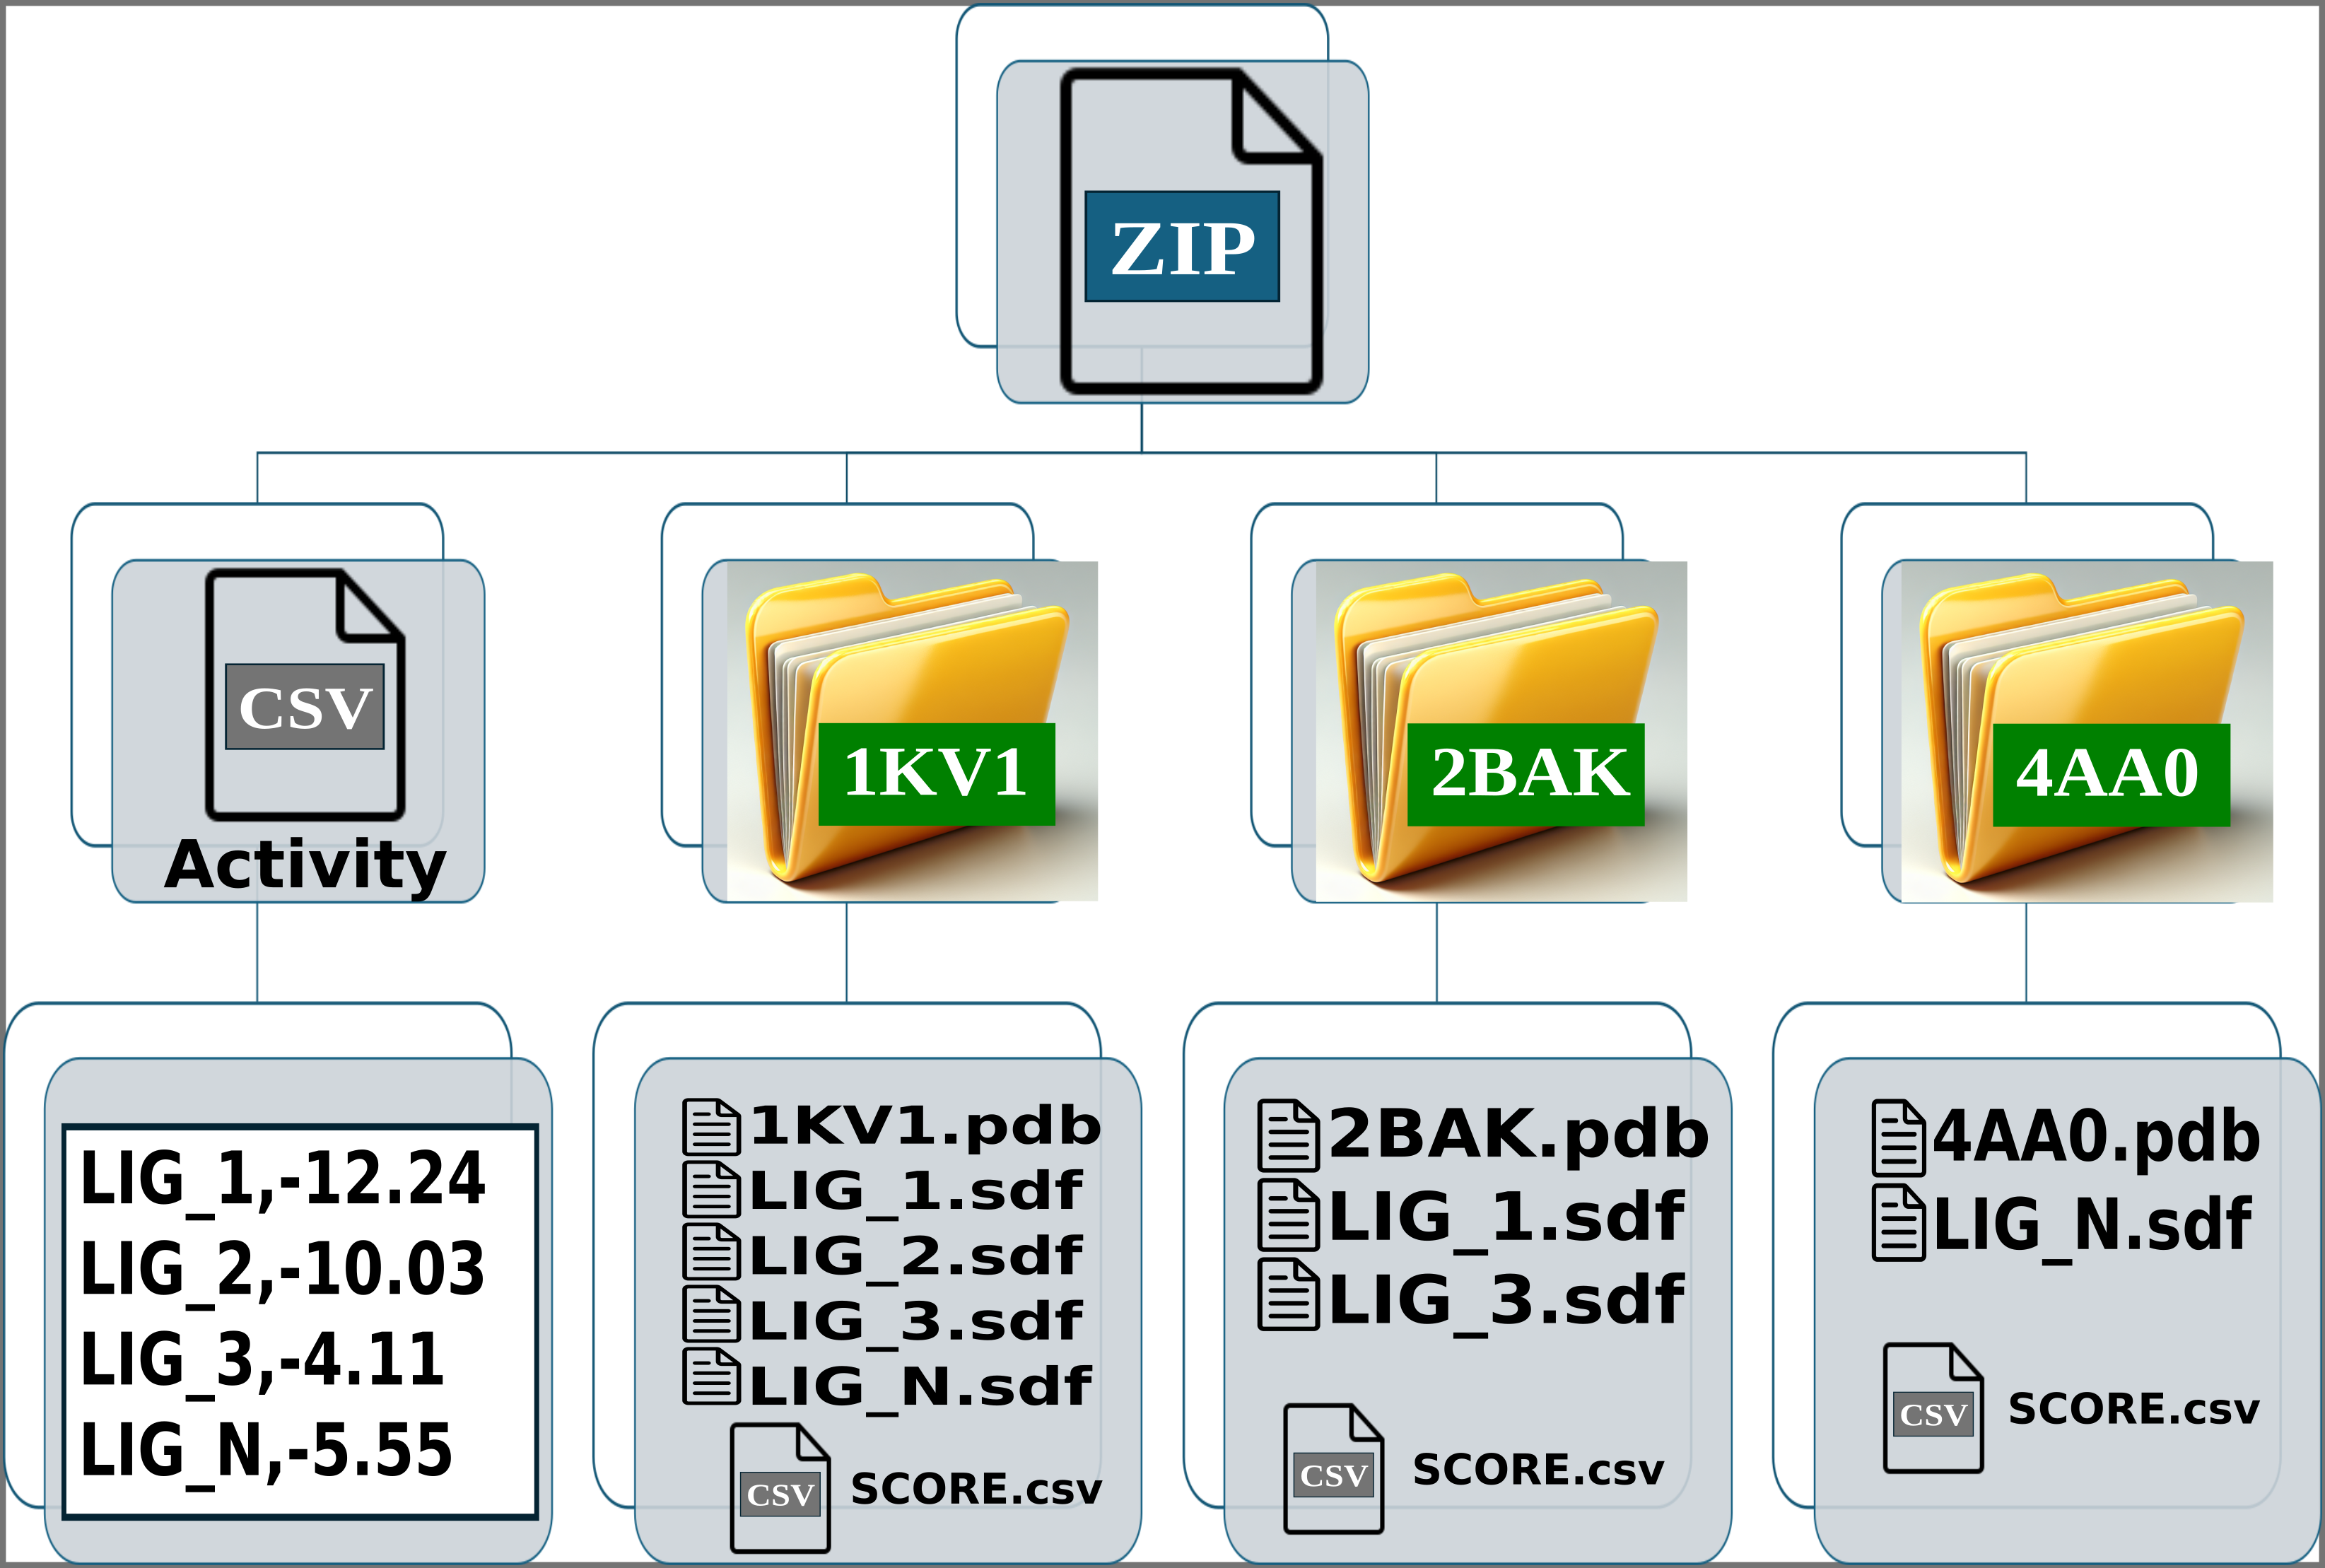
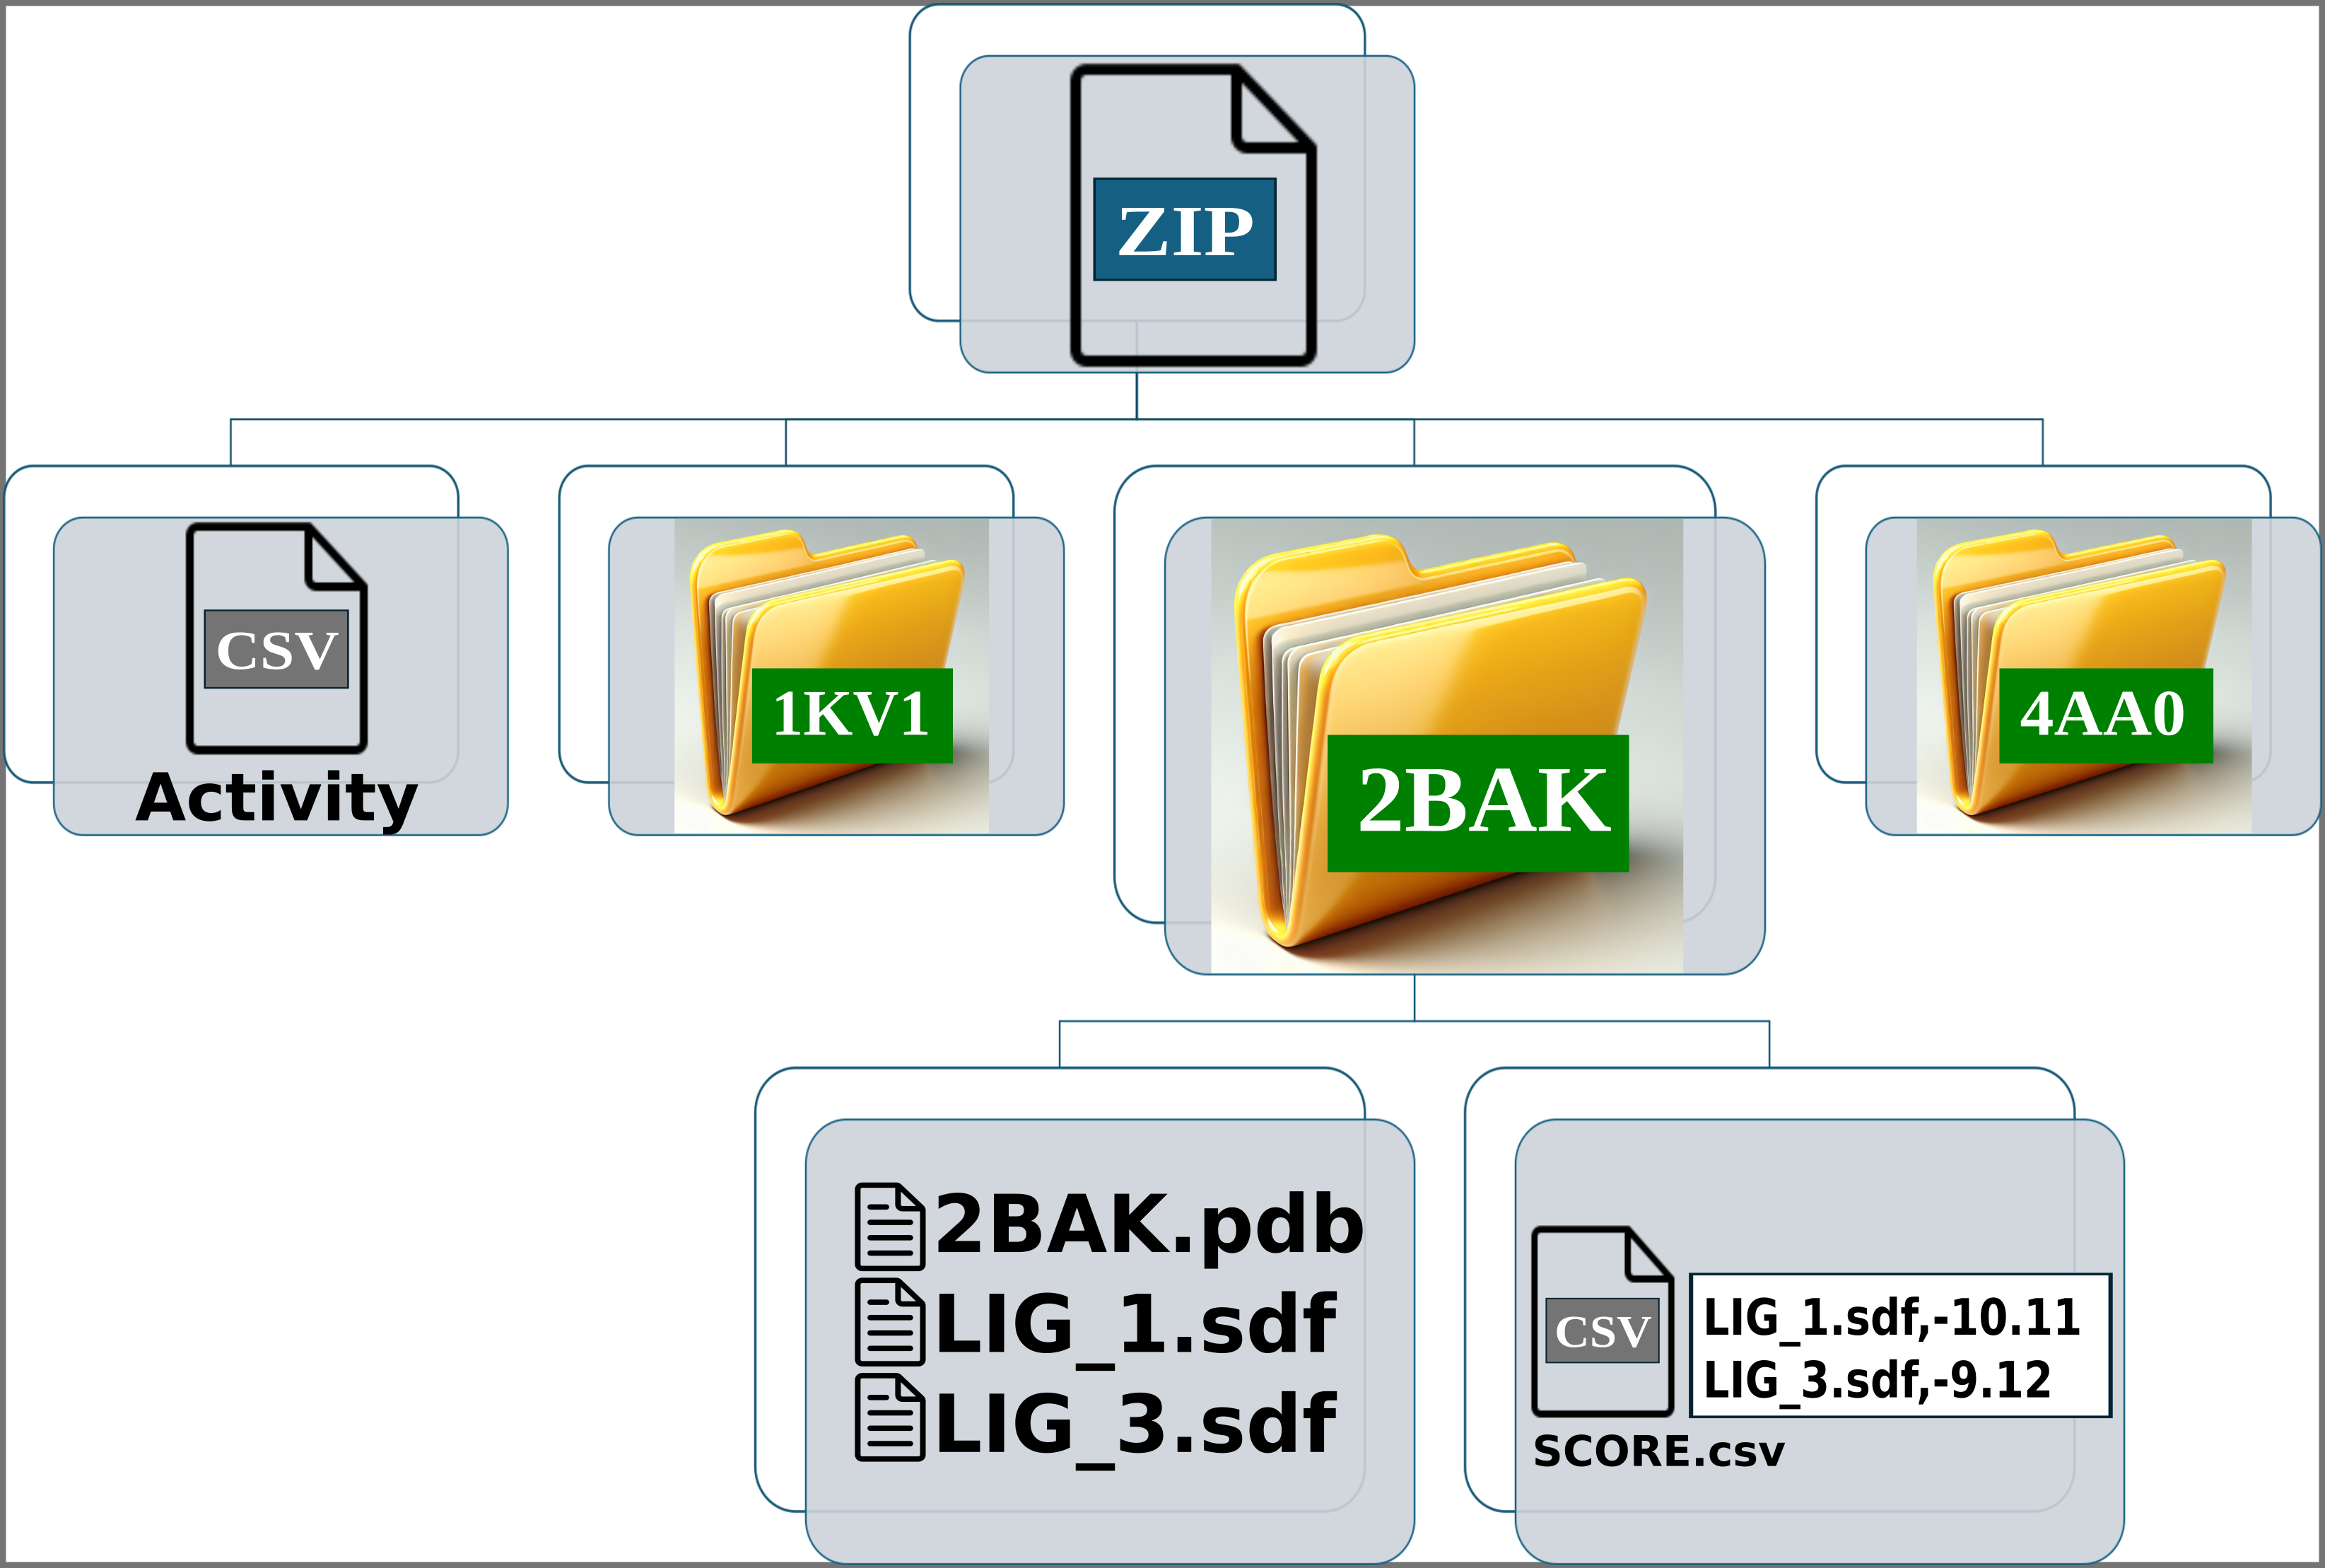
In the activity CSV file, each ligand must have an associated experimental activity. The name of the ligands in the activity CSV must match the first line of the corresponding SDF or MOL files. For example, if a ligand is named LIG_1 in the activity CSV, it should appear as LIG_1 in the first line of the SDF or MOL files within the folders. However, the names of the SDF or MOL files do not need to match the names in the activity CSV. For instance, LIG_1 in the activity CSV can correspond to file1_LIG_1.sdf. Additionally, each SDF or MOL file should contain only one binding pose per ligand. Finally, each folder should include one protein conformation in PDB format, along with one or more SDF files for the ligands and the CSV file containing the computational scores.
How to create input from an Excel
Below are 4 images used to create the input required for processing results from an Excel file.
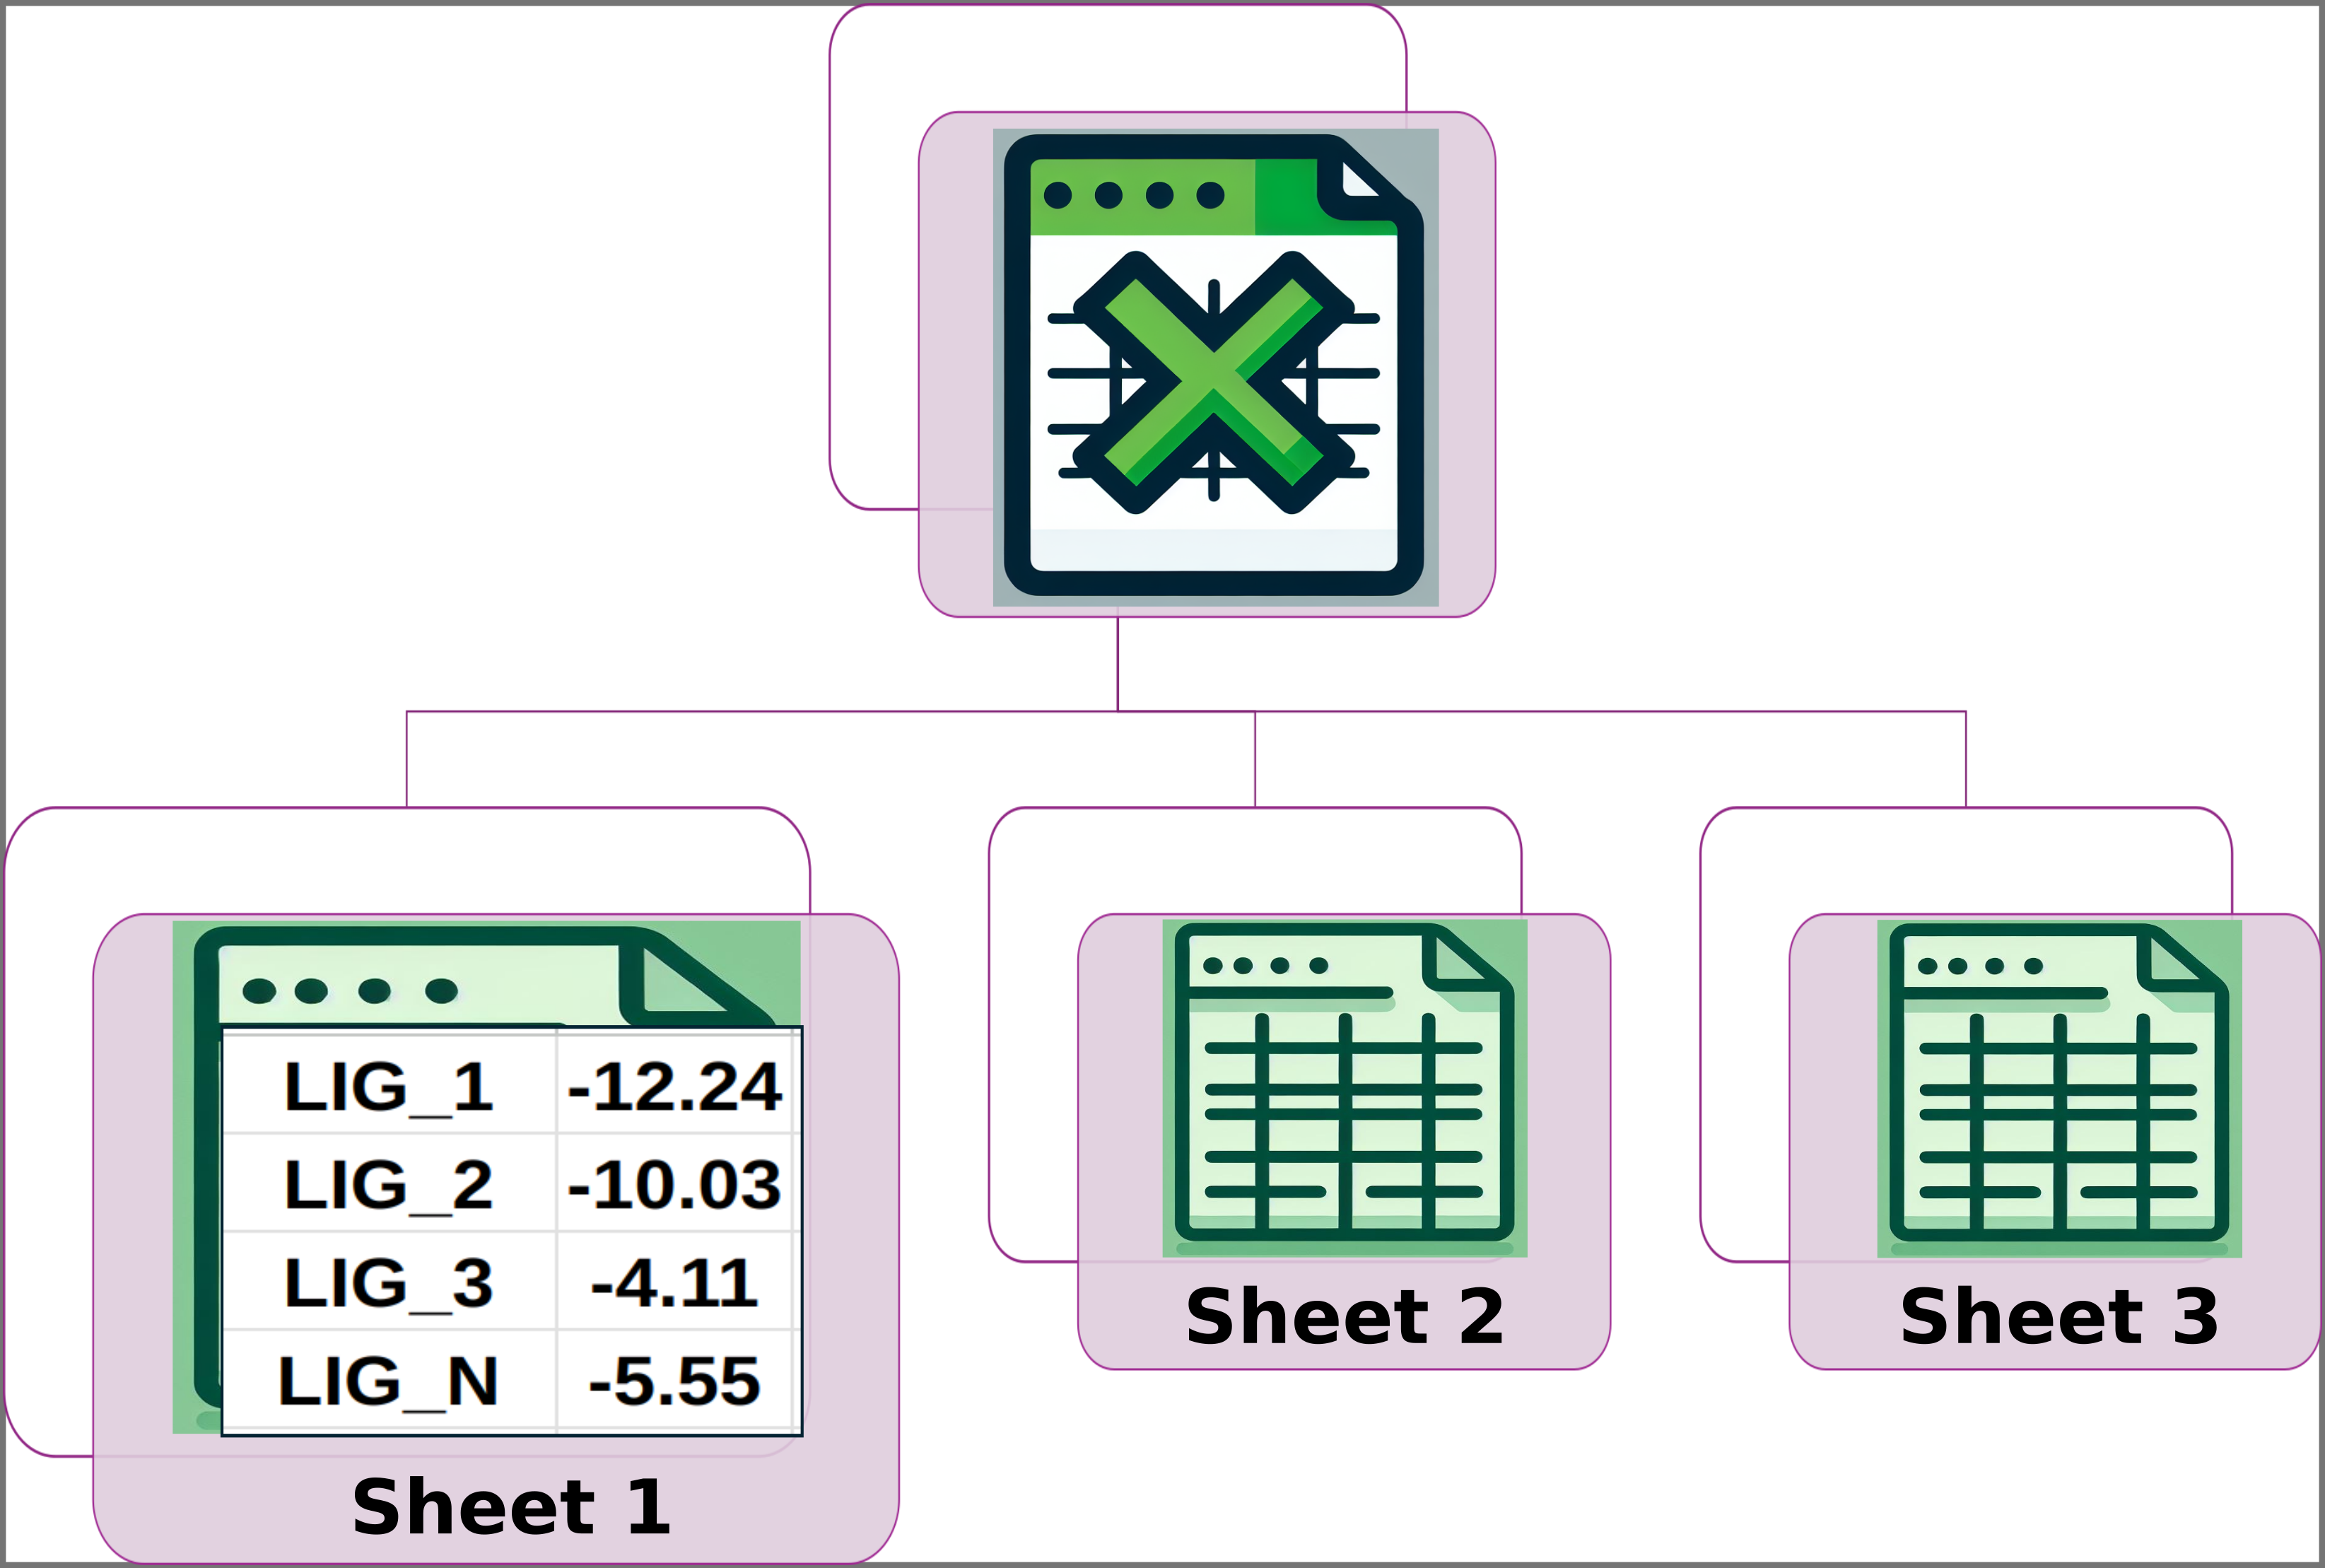
Img. 1: General input scheme: the platform accepts an Excel file with three sheets.
Img. 2: Sheet 1 should contain two columns. The first column should include the names of the ligands and the second should include their normalized experimental activity values.
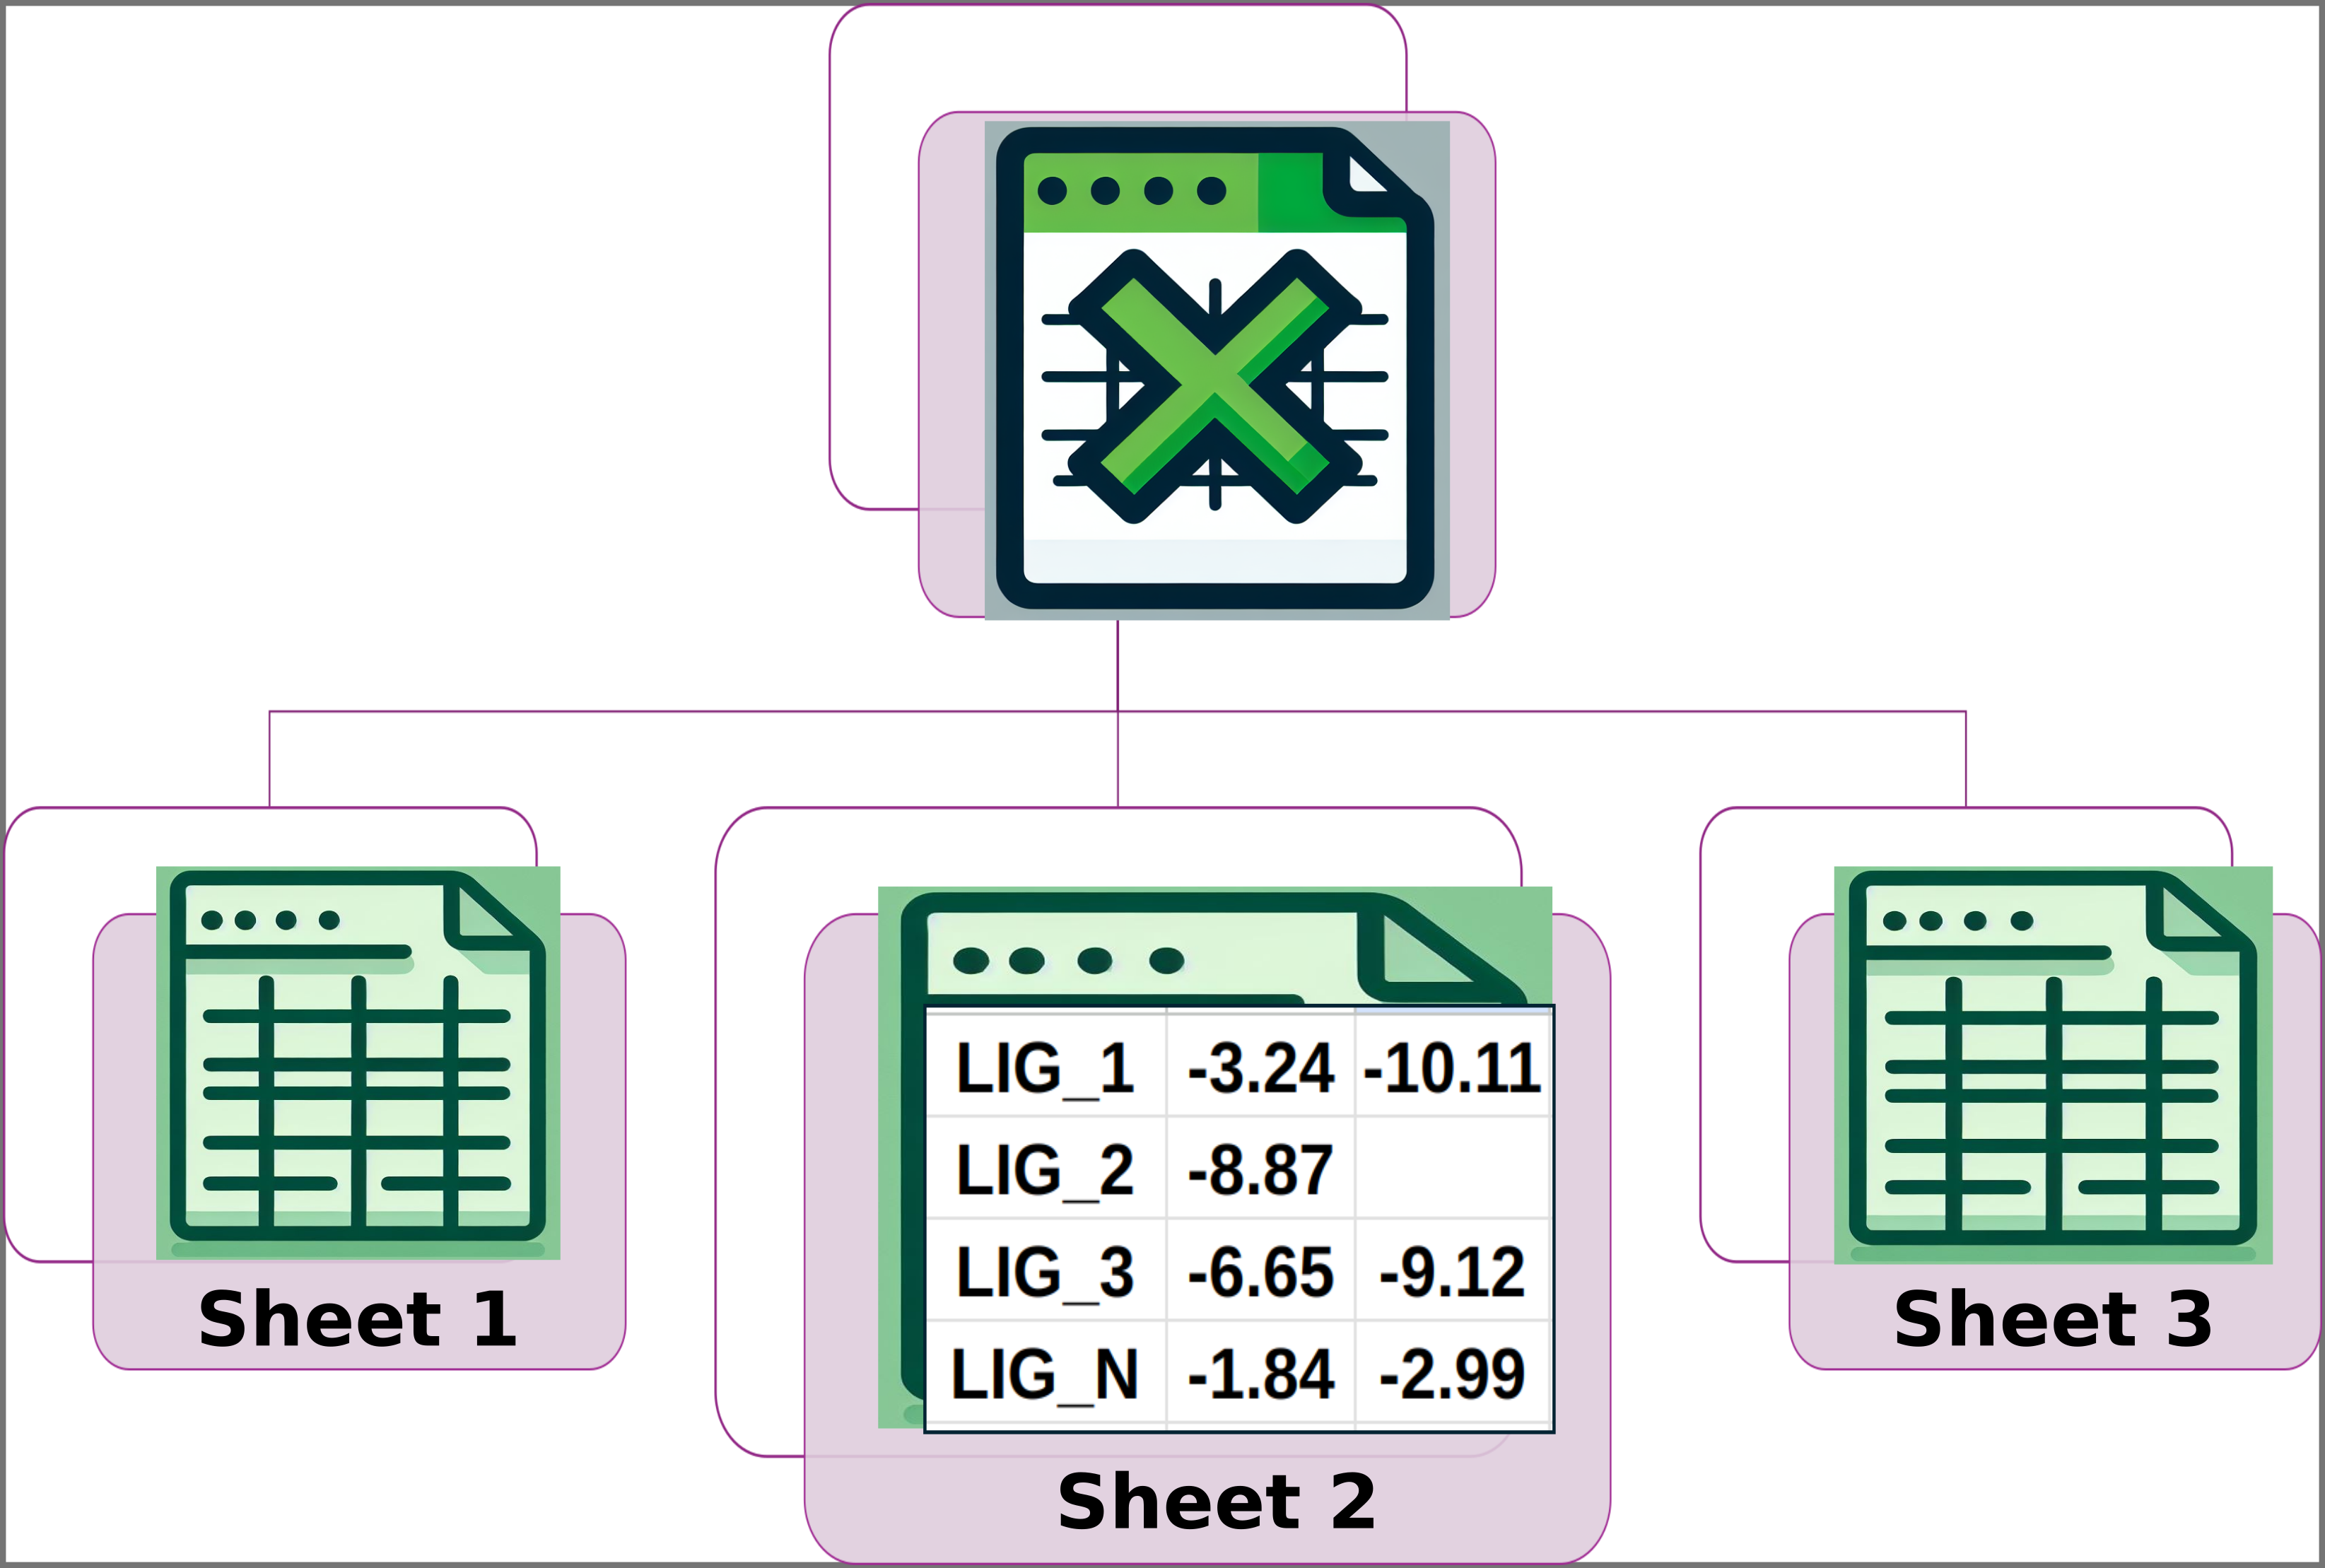
Img. 3: Sheet 2 should have the names of the ligands in the first column. The subsequent columns should contain the computationally measured energies for each ligand.
Img. 4: Sheet 3 should have the names of the ligands in the first column. The following columns should contain the names of the protein conformations where the computational energy for each ligand was obtained.
Imagen 1/4
Click the arrow button to switch to the next image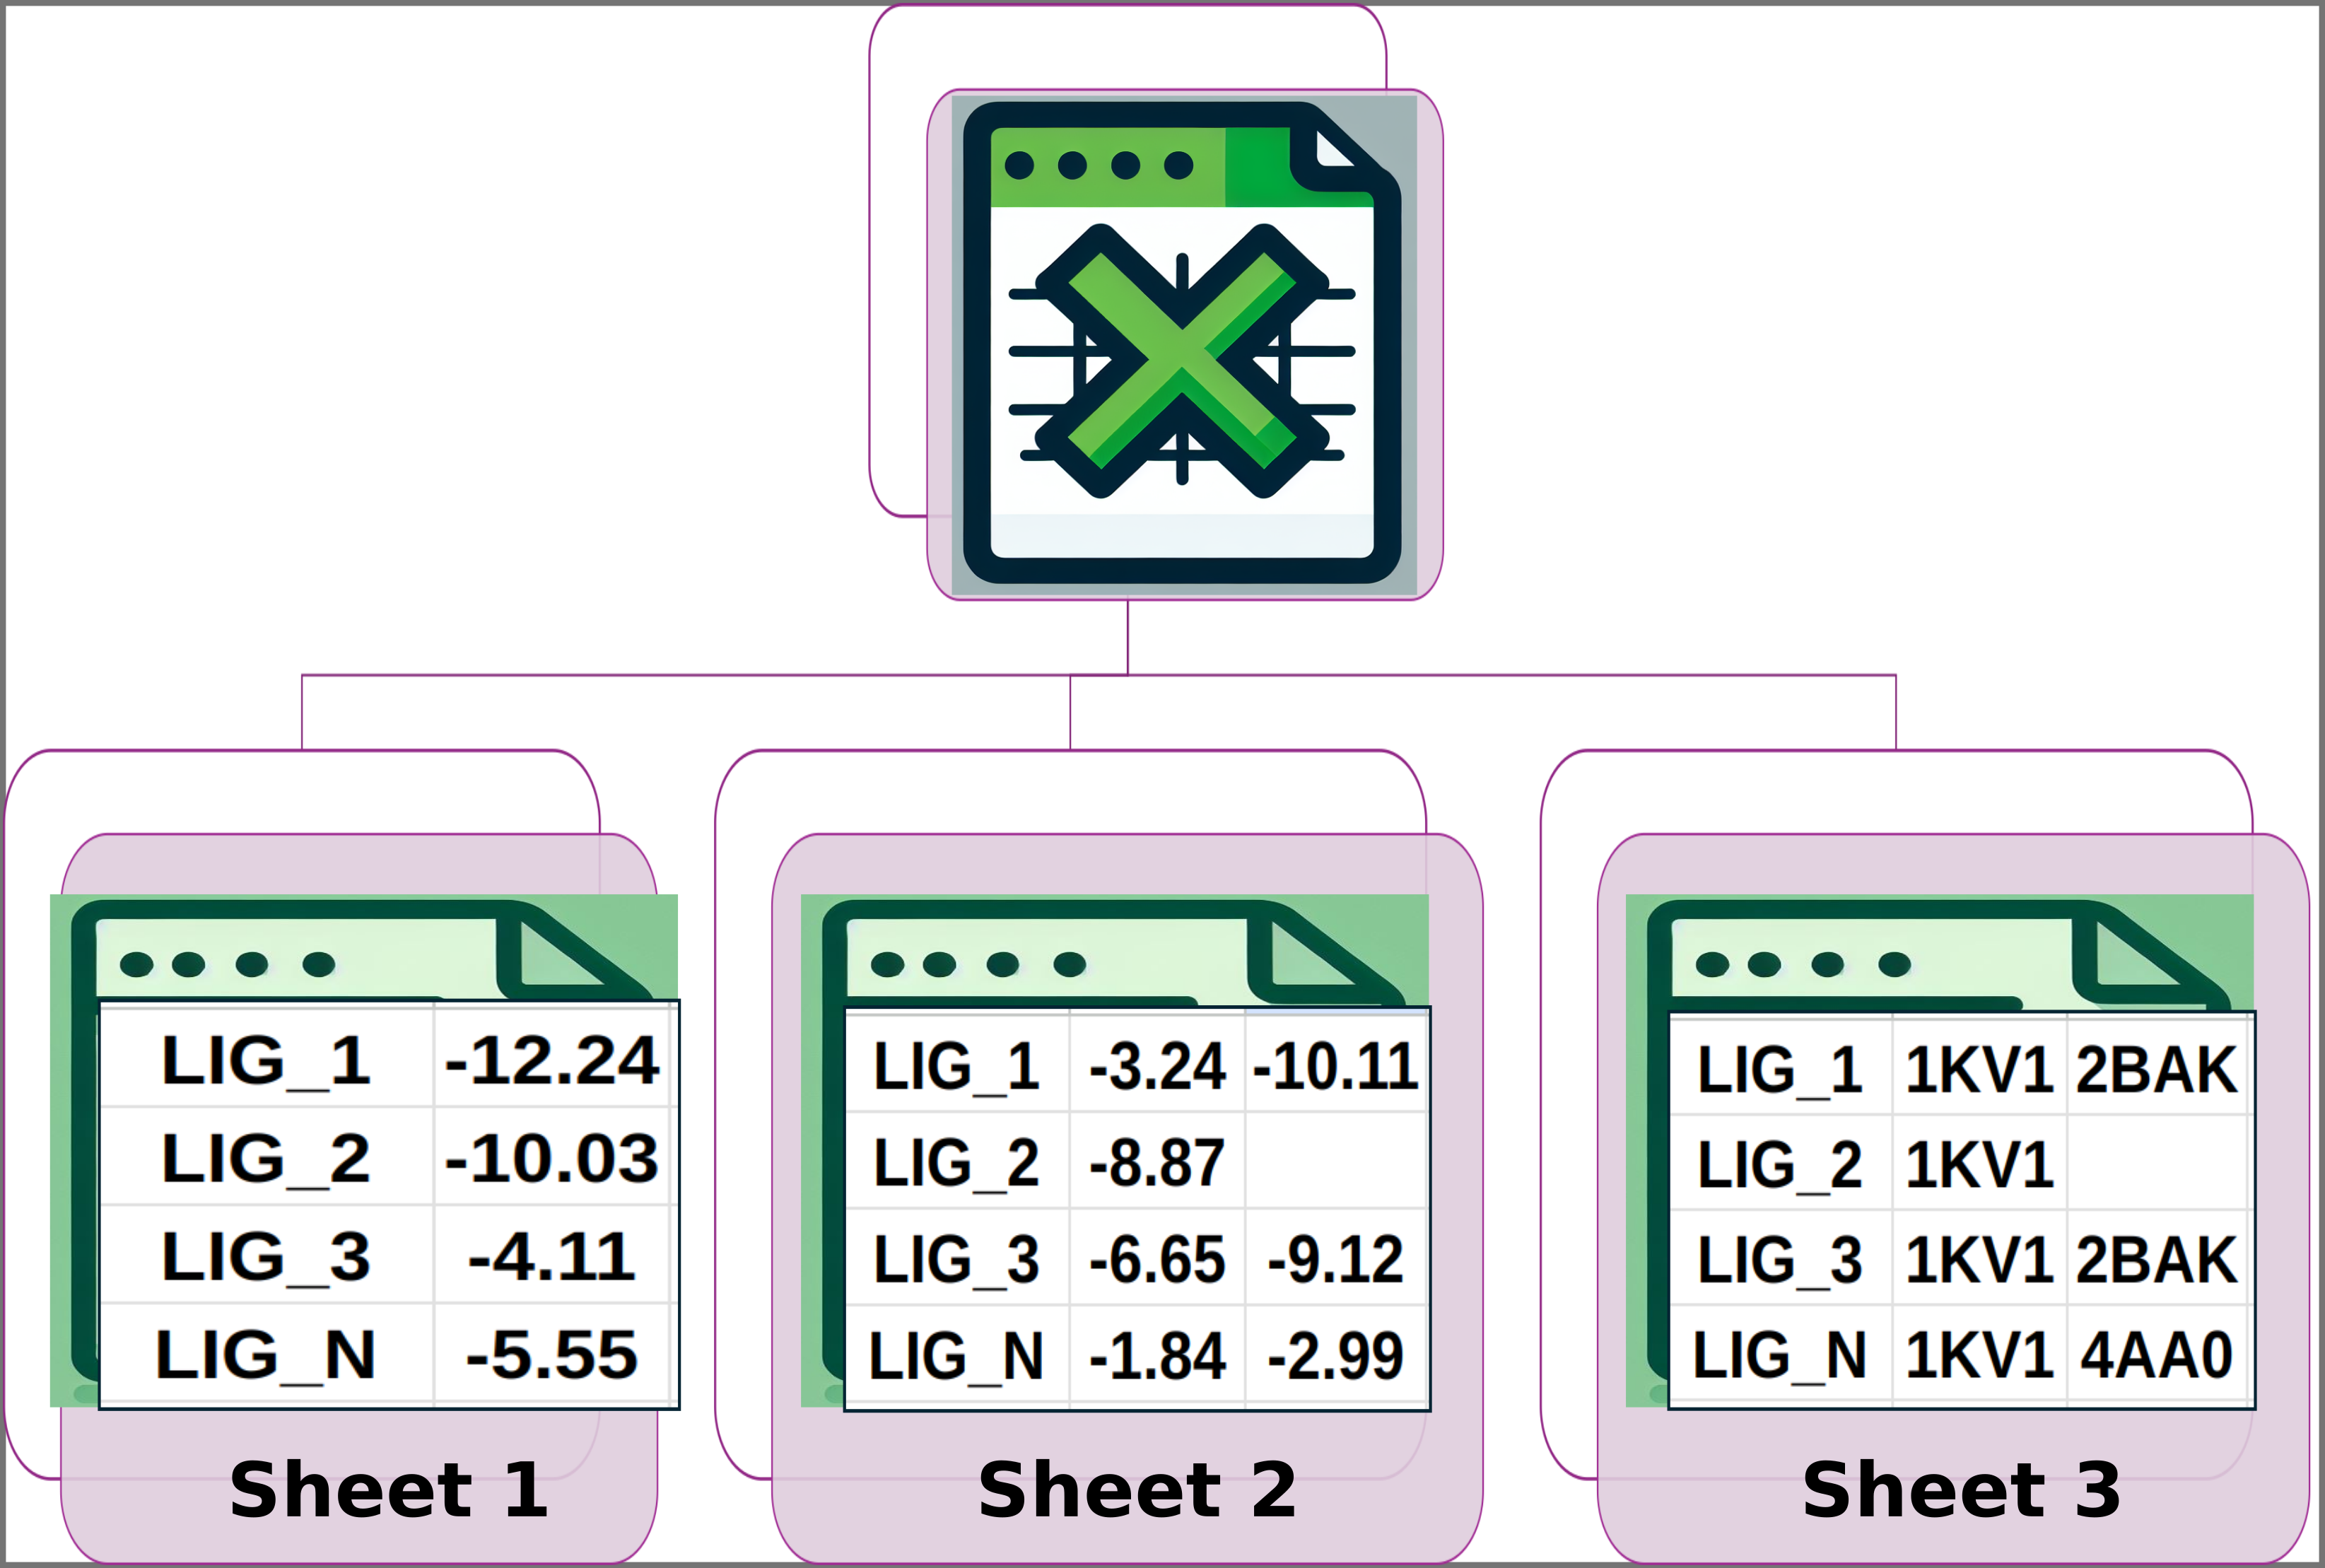
In Sheet 1, all ligands must have a reported experimental activity, which must be a numerical value. In Sheet 2, except for the first column, all data must be numerical. Additionally, the number of columns for each ligand must be the same in Sheets 2 and 3. Finally, the names of the ligands must be consistent across all three sheets, and the ligand names must appear in the same rows in each sheet. For example, if LIG_3 is in row 5 of Sheet 1, it must also be in row 5 of Sheets 2 and 3, and the same applies to the other ligands.
How to upload your cross-docking results to CorrEA
The following four images explain parts of the form to complete to use the platform.
Img. 1: Click on Vina, other docking software, or Excel.
Img. 2: The general form includes the following fields: Upload File (ZIP or Excel) in the first row, Job Name, Email, and Most Active Ligand (the ligand with the lowest experimental unit) in the second row. The third row includes titles for Experimental Activity (Ki/IC50), e.g., pIC50 [µM], and Computational Energy [kcal/mol], e.g., Docking score [kcal/mol]. These titles will appear in tables and graphs. In the fourth row, clicking Show will display the genetic algorithm operators. Finally, in the last row, there are buttons to either cancel or run the correlation calculation.
Img. 3: Genetic algorithm operators with their default values. You can customize these values according to your needs.
Img. 4: At the top right of the form, Download Example allows you to select one of our examples.
Img. 5: In the middle right of the form, there is a video explaining how to download and run one of our examples.
Imagen 1/5
Click the arrow button to switch to the next image

In the general form, the Upload File, Job Name, and Most Active Ligand fields are mandatory. The Email, Experimental Activity, and Computational Energy fields are optional. For the Most Active Ligand field, enter the name of the most experimentally active ligand, which corresponds to the compound with the lowest experimental value in the series. This ensures that the most active compounds are assigned the most favorable computational energies.
Command-line usage
To run the CorrEA script you need the following:
Use Python 3.8 or higher with Numpy and Pandas modules installed.
For an execution with the default parameters of the genetic algorithm.
python corrEA_script.py -s computation_energies.csv -a experimental_activities.csv -r protein_conformation_numbers.csv
For more information, use the -h help command.
python corrEA_script.py -h
The CorrEA script parameters are located in "About." To access them, click the following link:
Download our CorrEA script as a ZIP file. Inside, you will find the script corrEA_script.py along with the files computation_energies.csv, experimental_activities.csv, protein_conformation.csv, and protein_conformation_numbers.csv.
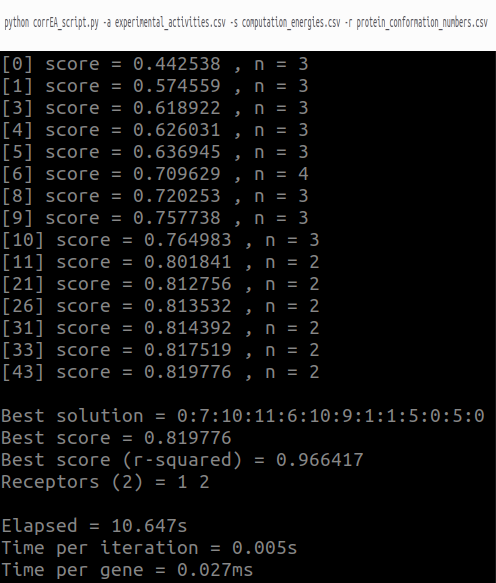
Output when running corrEA_script.py:
Rows 1: command line used to run the CorrEA script.
Rows 2 through 16 show the correlation results: Inside the brackets is the iteration number of the genetic algorithm. The score represents the highest correlation value found in that iteration, while n indicates the number of protein conformations.
Best solution: Index of the optimized pose per ligand. For example, the first '0' corresponds to the first ligand. Therefore, its computational energy value and protein conformation name are in the second column and first row of the computation_energies.csv and protein_conformation.csv files. The same applies to the indexes of the other ligands.
Best score: R2 correlation value with penalty.
Best socore (r-squared): R2 correlation value without penalty.
Receptor: Index of protein conformations. Values 1 and 2 correspond to the 1WBV and 2BAK crystal structures of p38alpha.
Elapsed: Total calculation time in seconds.
Time per iteration: Average calculation time per iteration in seconds.
Time per gene: Average calculation time per combination in milliseconds.
Result for p38alpha